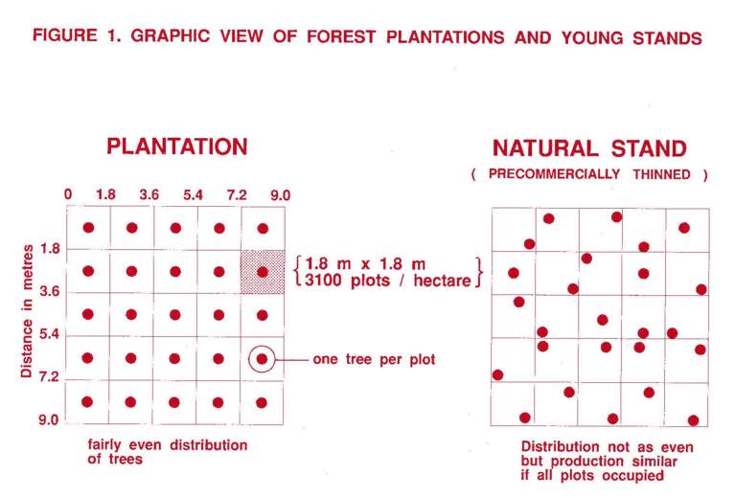
| Figure 1 | Graphic view of forest plantations and young stands |
||
| Figure 2 | Site production between good and poor stand establishment practices |
||
| Figure 3 | Total growing stock percentages for 16 native trees |
||
| Figure 4 | Sample of forest succession found in Nova Scotia |
||
| Figure 5 | Early stand development of shade intolerant and shade tolerant species |
||
| Figure 6 | Methods of natural regeneration |
||
| Figure 7 | Shelterwood cutting system |
||
| Figure 8 | Shade zone effects on forest floor vegetation |
||
| Figure 9 | Comparison of red spruce seedling growth at two different |
||
| Figure 10 | Manual cutting to control sprout dominance |
||
| Figure 11 | Site preparation equipment used prior to planting |
||
| Figure 12 | Species to plant |
||
| Figure 13 | Stand establishment flowchart (** Abbreviations explained) | ||
| List of Tables |
|||
| Table 1 | Shade tolerance and forest succession relationships of Nova Scotia trees |
||
| Table 2 | Commercial tree species priority based on potential economic value and growing stock percentages |
||
| Table 3 | Average range of maturity for commercial species in Nova Scotia |
||
| Table 4- (1) Table 4- (2) |
|||