For additional information relating to this article, please contact:
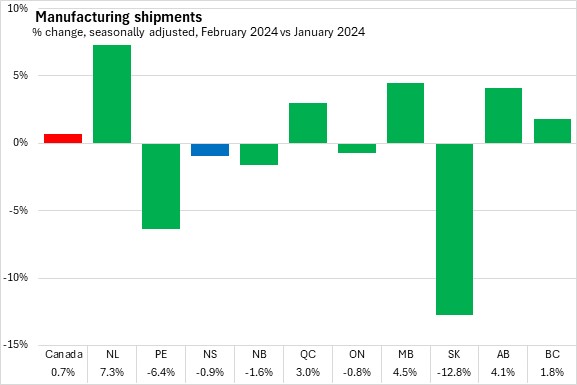
April 15, 2024MANUFACTURING SHIPMENTS, FEBRUARY 2024 Monthly (seasonally adjusted, February 2024 vs January 2024)
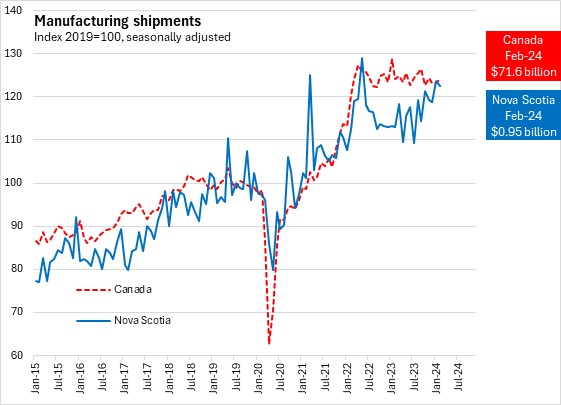
Nova Scotia's manufacturing shipments decreased 0.9% to $952 million. National shipments increased 0.7 to $71.6 billion.
Manufacturing shipments were up in 5 of 10 provinces, Saskatchewan had the largest reported decline. Newoundland and Labrador had the largest reported growth.
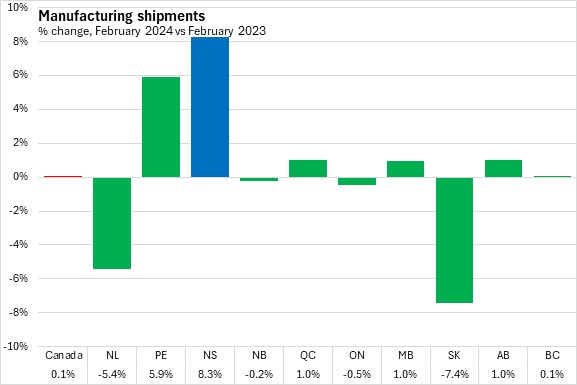
Year-over-year (February 2024 vs February 2023)
Nova Scotia's manufacturing shipments increased 8.3%. National shipments decreased 0.1%.
Manufacturing shipments were down in 6 out of 10 provinces. Nova Scotia reported the largest increase while Saskatchewan posted the largest decline.
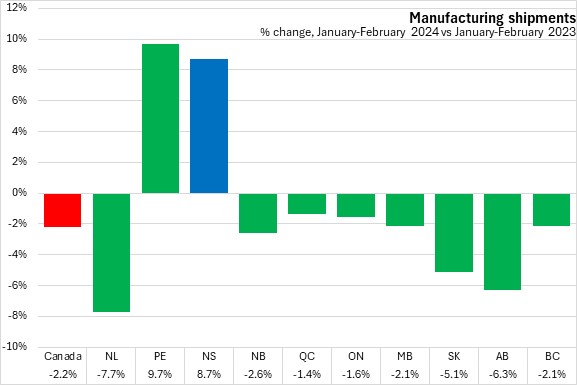
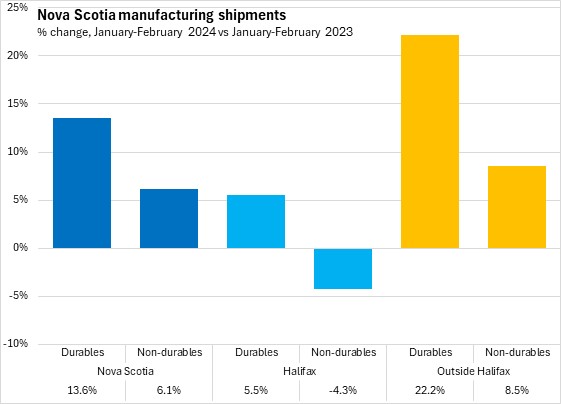
Year-to-date (seasonally adjusted, January-February 2024 vs January-February 2023)
Nova Scotia's manufacturing shipments increased 8.7%. National shipments decreased 2.2%.
Manufacturing shipments were down in 8 of 10 provinces. Newfoundland and Labrador reported the steepest decline. Prince Edward Island reported the largest increase.
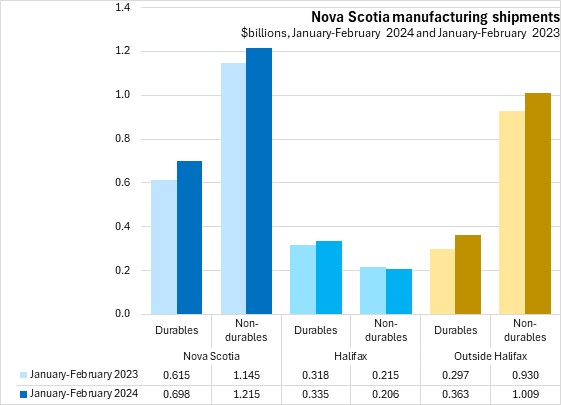
Nova Scotia's durable goods shipments increased 13.6%, while non-durable goods shipments increased 6.1%. In Halifax, durable goods shipments increased 5.5%, while non-durables decreased 4.3%. Outside Halifax, durable goods shipments increased 22.2%, while non-durables increased 8.5%.
Trends
Nova Scotia’s manufacturing shipments maintained an upward trend through 2023 and first months of 2024. Periodic spikes in Nova Scotia's shipments values are not uncommon. Nationally, manufacturing shipments have been relatively flat since 2022.
Statistics Canada. Table 16-10-0047-01 Manufacturers' sales, inventories, orders and inventory to sales ratios, by industry (dollars unless otherwise noted); Table 16-10-0048-01 Manufacturing sales by industry and province, monthly (dollars unless otherwise noted) (x 1,000); Table 16-10-0011-01 Manufacturing sales, by industry for 12 Selected Census Metropolitan Areas (x 1,000)