For additional information relating to this article, please contact:
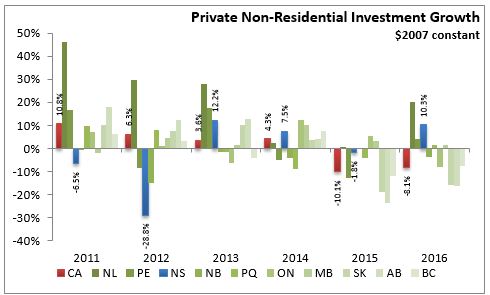
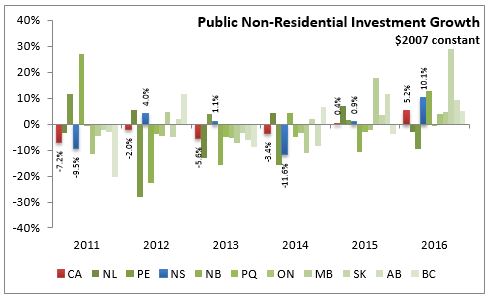
November 17, 2017STOCK AND CONSUMPTION OF FIXED CAPITAL 2016 Statistics Canada has released details of fixed capital assets for 2016. Nova Scotia private non-residential investment (all figures in real terms - adjusted to 2007 constant prices) increased 10.3 per cent while national investment was down 8.1 per cent. Private investment was down in Saskatchewan, Alberta and British Columbia for the second consecutive year, and New Brunswick and Ontario. Newfoundland and Labrador private investment increased 20.3 per cent in 2016. Investment in Government sector assets increased 10.1 per cent in Nova Scotia and 5.2 per cent in Canada in 2016.
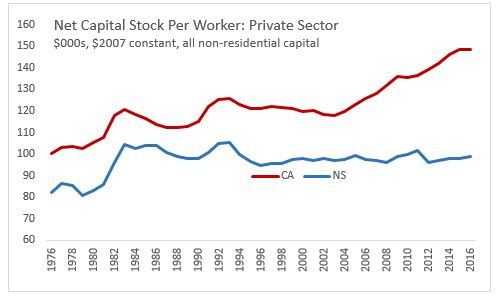
Over the long run, Nova Scotia's real private sector investment per worker has generally lagged the national average, with periodic bursts of activity. In previous years, NS real investment per worker has been short of the national average as investment projects in resource-rich provinces outpaced non-resource provinces. The net capital stock per worker for the private sector was $99,109 in Nova Scotia in 2016 compared to nationally of $148,552.
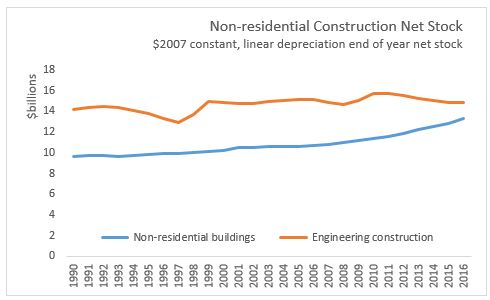
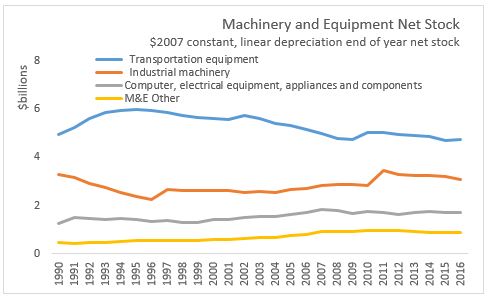
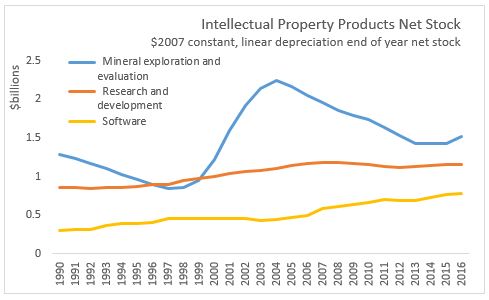
The net capital stock is calculated for the end of the year after investment is added and depreciation of existing assets is subtracted. A decrease in the capital stock occurs when the amount of depreciation exceeds the flow of new investment. In 2016, the non-residential capital stock in Nova Scotia increased 1.0 per cent from $41.6 billion to $42.0 billion. Among asset classes the net stock increased for non-residential building (+3.6%), transportation equipment (+0.6%), mineral exploration and evaluation (6.1%), and software (+1.7%) but declined for engineering (-0.2%), industrial machinery (-3.4%), research and development (-0.5%), computer/electrical equipment (-0.1%) and other machinery and equipment (-1.8%).
Stock and Consumption of Fixed Capital 2016