For additional information relating to this article, please contact:
June 26, 2017TRADE GAINS AND GDP GROWTH, CANADA AND NOVA SCOTIA, 2015 PURCHASING POWER
The object of the following analysis is to address the use of important trade indicators, and Nova Scotia’s recent international trade performance. The primary indicator is real gross domestic income (rGDI) and its growth, relative to other economic indicators.
Real gross domestic income (rGDI) measures the purchasing power generated by domestic production and international trade. Over time, the volume of exchange between international exports and international imports can change (fewer exports required to purchase more imports, or vise-versa). The ability to purchase more with less is an increase in purchasing power – a wealth effect. Thus, rGDI is equal to the value of real gross domestic product (rGDP) plus the value of the net trading gain. By definition, rGDI can be greater than, equal to, or less than rGDP.
Changes to the volume of exchange in international trade are attributed to changes in the province’s terms of trade and the foreign exchange rate. While terms of trade and foreign exchange has an impact on the whole economy, international trade represents only a small portion of the economy, and thus the impact of the international trade section will be somewhat muted. Trading gain measures the contribution of international trade on the relative wealth of the provincial economy.
Real GDI is an alternative (and arguably better) measure of the material standard of living or investment in production capacity. It is a more accurate reflection of our involvement in international trade.
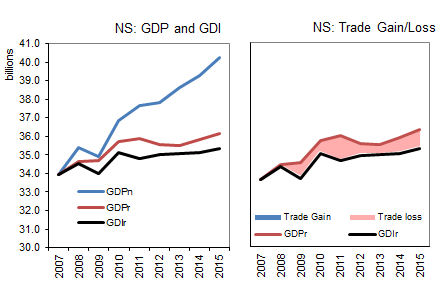
NOVA SCOTIA
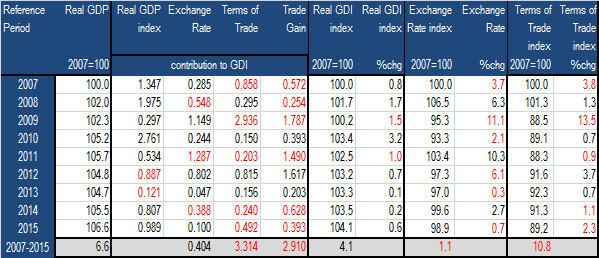
When computing the contribution to growth of rGDI, the contribution of growth in rGDP is taken at full value, while the contribution of terms of trade and the contribution of the real exchange rate is dependant (weighted) on the relative size of the export and import market, and price changes in these markets.
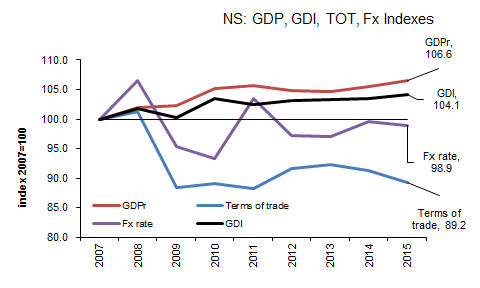
Over the period 2007 to 2015, Nova Scotia’s rGDP increased 6.6 points. Nova Scotia’s terms of trade index declined 10.8 points but its contribution to growth in rGDI was only a negative 3.314 points. The real exchange rate index declined 1.1% over the period, but its contribution to growth in rGDI was a net increase of 0.404 points. .
Together the contribution of the real exchange rate growth (+ 0.404 points), less the declining contribution of the terms of trade (-3.314 points) yields a net negative growth in the “trade gain” of -2.910 points. The “trade gain” combined with the increase in rGDP (+6.6%) results in a positive growth rate of 4.1% in rGDI index over the 2007-2015 period to 104.1.
As the growth rate in rGDI (+4.1%) is less than the growth rate in rGDP,(+6.6%) then Nova Scotia purchasing power has declined 2.5 points over the period. (106.6 – 104.1 = 2.5).
In Nova Scotia 2015, the purchasing power index (gross domestic income) increased by 0.6% from 2014 to 104.1 (2007=100). While real gross domestic product’s contribution increased rGDI growth by 0.989 percentage points, the trading gain contribution (the real exchange rate plus the terms of trade contributions) lowered rGDI growth by 0.392 percentage points to 0.6%.
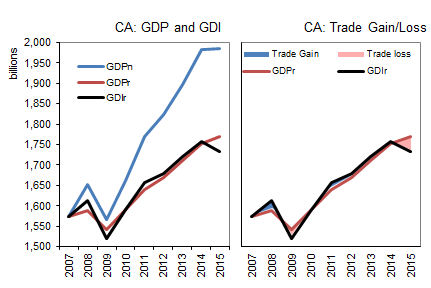
CANADA
When computing the contribution to growth of rGDI, the contribution of growth in rGDP is taken at full value, while the contribution of terms of trade and the contribution of the real exchange rate is dependant (weighted) on the relative size of the export and import market, and price changes in these markets.
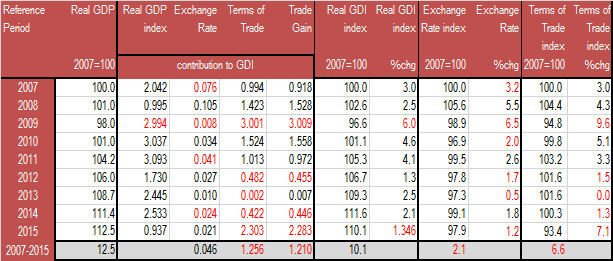
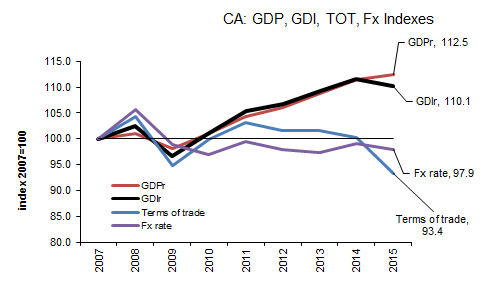
Over the period 2007 to 2015, Canada’s rGDP increased 12.5 points. Canada’s terms of trade index declined 6.6 points but its contribution to growth in rGDI was -1.256 points. The real exchange rate index declined 2.1% over the period, but its contribution to growth in rGDI was a positive 0.046%.
Together the contribution of the real exchange rate growth (+0.046 points), less the declining contribution of the terms of trade (-1.256 points) yields a net negative growth in the “trade gain” of -1.210 points. The “trade gain” decline, combined with the increase of 12.5% in rGDP, results in a positive growth rate of 10.1% in the rGDI index over the 2007-2015 period to 110.1.
As the growth rate in rGDI (10.1%) is less than the growth rate in rGDP (12.5%), then Canada’s purchasing power has declined 2.4 points over the period. (112.5 – 110.1 = 2.4).
In Canada 2015, the purchasing power index (rGDI) declined by 1.3% from 2014 to 110.1 (2007=100). Real gross domestic product’s contribution increased rGDI growth by 0.937 points, the trading gain contribution real exchange rate contribution increased rGDI growth by 0.021 percentage points, and terms of trade contribution decreased rGDI growth by 2.303 percentage points. (0.937 + 0.021 - 2.303 = -1.346).
Computed from CANSIM Tables 380-0065 and 380-0101.