For additional information relating to this article, please contact:
October 07, 2016LABOUR MARKET TRENDS - SEPTEMBER 2016 TRENDS SEPTEMBER 2016
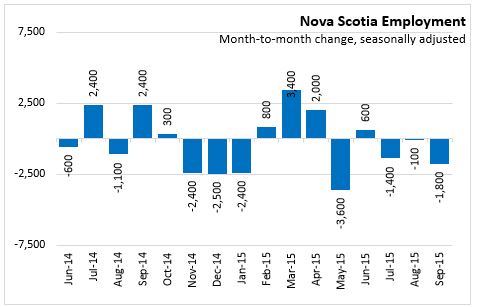
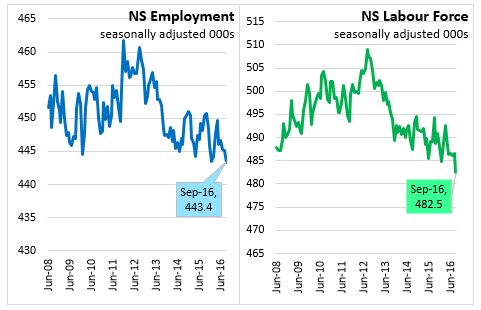
Nova Scotia's seasonally adjusted employment decreased by 1,800 to 443,400 in September 2016. Employment in the province has declined in four of the last five months.
Compared to August, the labour force decreased 4,100 to 482,500 in September. With labour supply declining at faster pace than labour demand, the net result was a 0.4 percentage point decrease in the seasonally adjusted unemployment rate to 8.1 per cent in September. With a decrease in the labour supply and an increase in the working age population (+0.2 per cent) the participation rate declined to 61.1 per cent for the month. September’s employment rate also decreased to 56.2 per cent.

In September, the overall decrease in employment reflects declines of both full-time (-1,700) and part-time (-100) employment. Shifts in the number of hours worked can result in swings between full-time and part-time jobs.
Compared with September 2015, the labour force has decreased by 11,900 (-2.4 per cent) while employment decreased by 7,100 (-1.6 per cent). Full-time employment levels in September are down 7,600 from the same month last year, offsetting a slight increase in part-time employment of 500. Overall, with labour supply decreasing at faster pace than the labour demand, the end result was a 0.8 percentage point decrease in the seasonally adjusted unemployment rate from 8.9 per cent in September 2015 to 8.1 per cent in September 2016.
Year-to-Date (Jan-Sept. 2016 vs Jan-Sept. 2015)
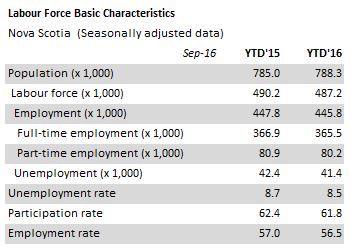
For the first nine months of 2016 compared to the first nine months of 2015, there was a decrease of 2,000 (-0.5 per cent) in the average employment level. Average full time employment was down 1,400 and there were 600 fewer part time jobs. The labour force was down 3,000 (-0.6 per cent) over this period. With labour supply falling at a faster pace compared with labour demand, the net result was a decline in the unemployment rate of 0.2 percentage points between the two periods. The average unemployment rate for the first nine months of 2016 was 8.5 per cent. The labour force participation rate dropped 0.6 percentage points to an average of 61.8 per cent in the first nine months of 2016. The employment rate also fell by 0.5 percentage points to 56.5 per cent.
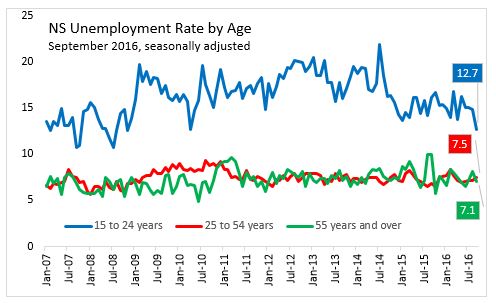
AGE COHORTS (Jan-Sept 2016 vs. Jan-Sept 2015)
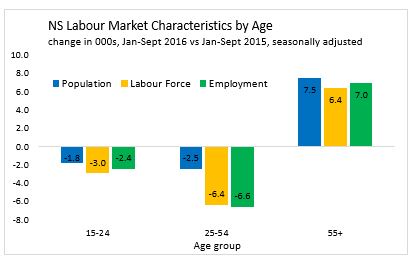
The labour force survey population estimate of 15-24 year olds declined by 1,800 between Jan-Sep 2015 and Jan-Sep 2016. The age group saw a decline of 3,000 in the labour force and 2,400 in employment during this period as the number of unemployed declined. The unemployment rate decreased 0.1 percentage points to 14.9 per cent for the Jan-Sep 2016 period.
Among Nova Scotians aged 25 to 54, the labour force declined 6,400 while employment declined 6,600 between the Jan-Sep 2015 and Jan-Sep 2016 period. The result was an increase in the unemployment rate of 0.2 percentage points to 7.4 per cent. The labour force participation rate fell 1.2 percentage points to 85.3 per cent for this age group.
Among Nova Scotians aged 55 and over, the population, labour force and employment have all increased over the first nine months of 2016 compared to the same period in 2015. Employment increased by 7,000, faster than the rise in the labour force of 6,400, resulting in a decline in unemployment of 600 and a fall in the unemployment rate of 1.0 percentage points to 7.4 per cent.
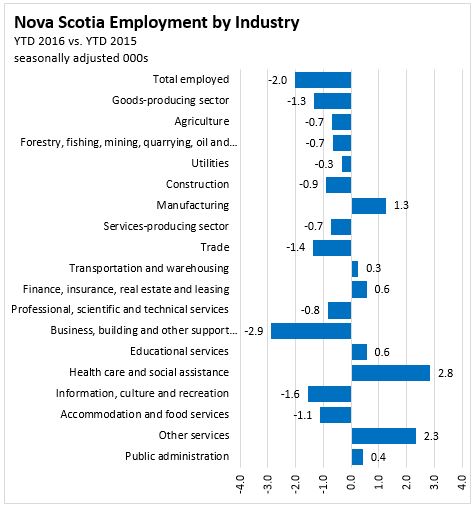
SECTORS (Jan-Sept 2016 vs. Jan-Sept 2015)
Comparing the first nine months of 2016 to the first nine months of 2015, employment in goods-producing sectors decreased by 1,300 jobs. Employment declines in agriculture, forestry/fishing, utilities and construction more than offset a gain of 1,300 net jobs in the manufacturing sector.
There was a net loss of 700 jobs in service-producing sectors. Employment gains in transportation, financial services, health, education, public administration and other services were not enough to override the job losses in wholesale/retail trade, professional services, business/support services (includes call centres), information/culture and accommodation/food services.
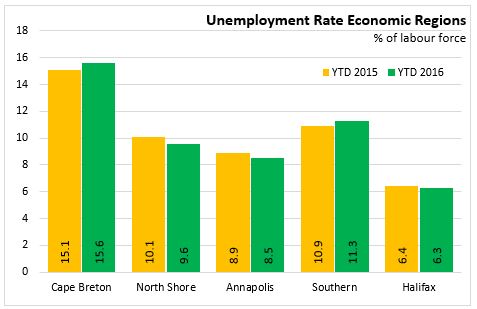
Regions (YTD 3 month moving average, unadjusted)
For the period of Jan-Sep 2016 compared to Jan-Sep 2015, the Halifax and Annapolis Valley regions employment growth outpaced labour force growth resulting in a lower average unemployment rates. In the Cape Breton and the Southern regions unemployment rates rose as employment (labour demand) declined at a faster pace than labour supply. In the Northern region the labour force decline was larger than the decline in employment resulting in a lower rate of unemployment.
The Cape Breton region reported a decrease in employment of 3,600 (-7.0 per cent) for the first nine months of 2016 over the first nine months of 2015. The labour force dropped by 3,900 (-6.4 per cent) for the same period. With employment decreasing at a faster pace than labour force, the end result was a 0.6 percentage point increase in the unemployment rate to 15.6 per cent.
For the North Shore region, employment decreased 600 (-0.9 per cent) for the first nine months of 2016 over the first nine months of 2015. Labour supply decreased by 1,000 (-1.3 per cent) for the same period. The larger decrease in labour supply resulted in a 0.5 percentage point decline in the unemployment rate to 9.6 per cent.
The Annapolis region experienced an increase in employment of 2,000 (3.7 per cent) and an increase in the labour force of 2,000 (3.4 per cent) for the first nine months of 2016 over the same period in 2015. The net result was a decline of 0.4 percentage points in the average unemployment rate to 8.5 per cent.
The Southern region saw employment fall by 1,600 (-3.2 per cent) and the labour force had a drop of 1,500 (-2.7 per cent) for the nine months of 2016 over the nine months of 2015. With the labour supply falling at a slightly slower pace than the decline in labour demand, the unemployment rate increased 0.4 percentage points to 11.3 per cent.
For the first nine months of 2016 compared to the first nine months of 2015, Halifax (HRM) experienced an increase in employment of 1,600 (0.7 per cent) along with an increase of 1,400 (0.6 per cent) in the labour supply. With labour market demand increasing at a slightly faster pace than labour supply, the net impact was 0.1 percentage point decrease in the unemployment rate to 6.3 per cent.
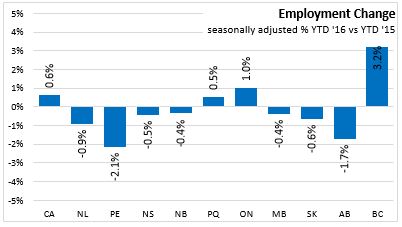
Provincial Comparisons
Employment has increased 0.6 per cent in Canada comparing the first nine months of 2016 with the first nine months of 2015. Over this period growth has only occurred in the three largest provinces: British Columbia (+3.2%), Ontario (+1.0%) and Quebec (+0.5%). The largest declines have been in Prince Edward Island (-2.1%), Alberta (-1.7%), and Newfoundland and Labrador (-0.9%).
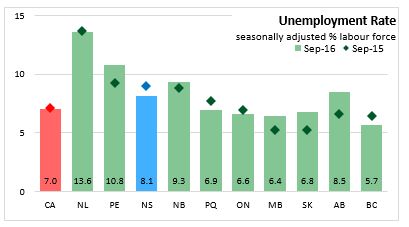
The Nova Scotia unemployment rate was 8.1 per cent in September 2016. In September of last year, the Nova Scotia unemployment rate was 8.9 per cent. Five provinces have lower unemployment rates compared to last year including Newfoundland, Nova Scotia, Quebec, Ontario and British Columbia. The lowest unemployment rate among the provinces in September 2016 was in British Columbia at 5.7 per cent.
National Comparisons: Cities
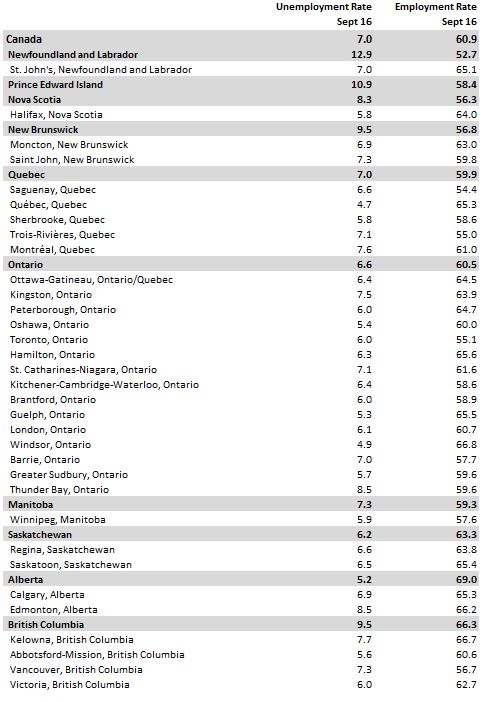
The seasonally adjusted unemployment rate for the Halifax Census Metropolitan Area was 5.8% per cent. Quebec and Victoria(both 4.7%) had the lowest unemployment rate in Canada this month.

The seasonally adjusted employment rate for the Halifax Census Metropolitan Area was down 0.4 percentage points from the previous month to 64.0 per cent in September 2016.

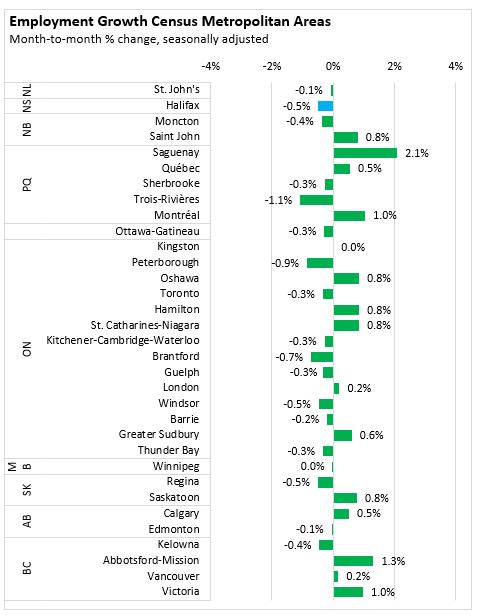
Employment in the Halifax CMA was down 0.5 per cent in September 2016 compared to the previous month. The largest monthly gain among CMAs was in Saguenay, Quebec were employment rose 2.1 per cent.
Note: Seasonally adjusted, 3 month average.