For additional information relating to this article, please contact:
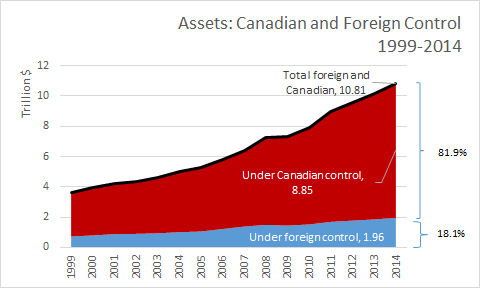
August 23, 2016FOREIGN CONTROL IN CANADA 2014 In Canada 2014, the value of Corporate assets increased 6.6% over 2013 to $10.81 trillion. Canadian controlled assets increased 6.8% to $8.85 trillion, and foreign controlled assets increased 5.6% to $1.96 trillion over 2013.
In 2014 while foreign control assets increased 5.6%, the percentage share of assets declined 0.2 percentage points over 2013 to 18.1% and declined 1.9 percentage points over 1999.
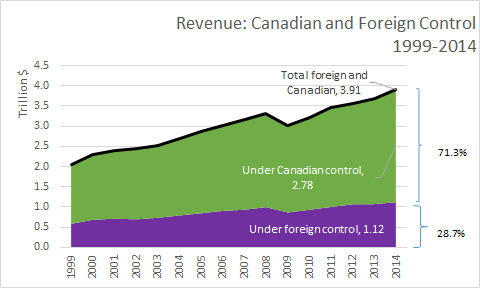
In Canada 2014, the value of Corporate revenue increased 5.7% over 2013 to $3.91 trillion. Canadian controlled revenue increased 6.3% to $2.78 trillion, and foreign controlled assets increased 4.2% to $1.12 trillion over 2013.
In 2014 while foreign control revenue increased 4.2%, the percentage share of revenue declined 0.4 percentage points over 2013 to 28.7% and remained unchanged over 1999
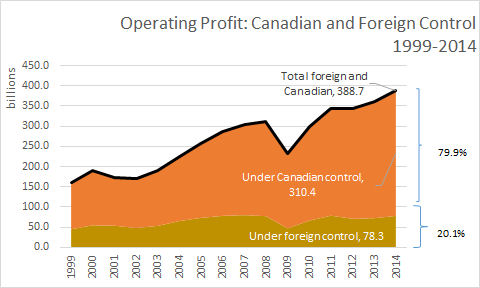
In Canada 2014, the value of Corporate operating profits increased 7.3% over 2013 to $388.7 billion. Canadian controlled operating profits increased 7.2% to $310.4 billion, and foreign controlled operating profits increased 7.7% to $78.3 billion over 2013.
In 2014 while foreign control operating profits increased 7.7%, the percentage share of operating profits remained unchanged over 2013 at 20.1% and declined 8.2 percentage points over 1999.
Foreign control is more prominent in the Manufacturing, Wholesale and Oil and gas extraction industries.

Source: CANSIM Table 179-0004