For additional information relating to this article, please contact:
May 26, 2016EMPLOYMENT, EARNINGS AND HOURS, MARCH 2016 Nova Scotians' average weekly earnings (including overtime, seasonally adjusted) increased $3.22 per week (0.4%) from February to $856.25 in March 2016. This is 3.5 per cent above the level in March of last year. Canadians' average weekly wages increased 0.5 per cent from February to $960.30 in March 2016, a 0.7 percent increase over March 2015.

This month, all provinces, except Saskatchewan, showed monthly increases in average weekly wages, the largest increase being in Quebec at 1.9 per cent. On a year-over-year basis, all provinces with the exception of Newfoundland and Labrador, Saskatchewan and Alberta showed wage increases. Quebec wages grew the most, at 3.6 percent year over year.

In March 2016, earnings in goods producing industries in Nova Scotia decreased 1.3 percent on a month to month basis. Goods producing industries average wages increased 1.6 percent year-over-year.
Service producing industries wages increased 0.8 percent month to month, and increased 3.9 percent compared to March 2015 (all figures are seasonally adjusted).
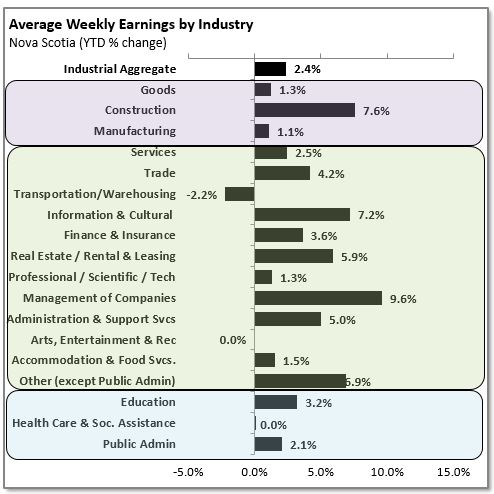
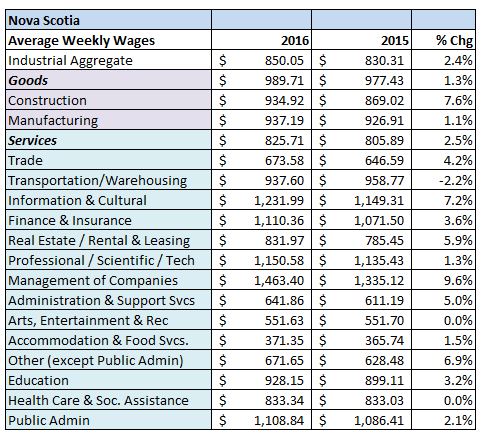
On a year-to-date basis, average weekly earnings are 2.4 per cent higher for the Jan-Mar 2016 period with a 1.3 per cent increase in goods sector and a 2.5 per cent increase in the services-producing sector.
EMPLOYMENT
In March 2016, Nova Scotia had 399,697 payroll employees, a 0.4 per cent decrease month to month, and 0.4 per cent fewer when compared to March of last year. Canada had 15.9 million employees, 0.2 per cent more than last month, and 0.9 percent more than a year ago.
On a year to date basis, Nova Scotia had 401,348 payroll employees, unchanged from the same period a year ago.

REFERENCE TABLES - YEAR TO DATE FIGURES

Source: Statistics Canada, Survey of Employment, Payroll, and Hours. CANSIM Table 281-0063