For additional information relating to this article, please contact:
February 12, 2016SURVEY OF HOUSEHOLD SPENDING, 2014 Statistics Canada released the 2014 results of the Survey of Household Spending today. This survey tracks average household spending by a number of categories of current consumption and other expenditures. It provides a snapshot to compare how much Canadian households spend on a wide range of goods and services.
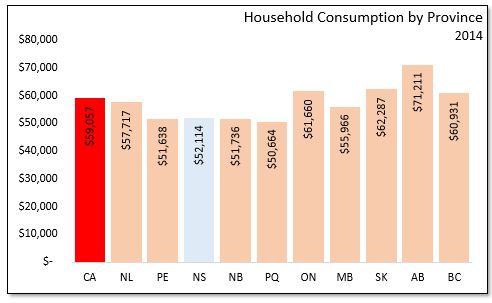
The average Nova Scotia household spent an average of $52,114 on goods and services in 2014, 0.6 percent higher than in 2013. This is below the national average of $59,057, and second highest in the region, behind Newfoundland and Labrador ($57,717). Alberta households had the highest average spending at $71,211.

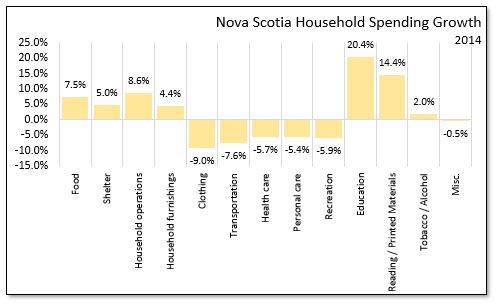
Looking closer at types of expenditure, in 2014 Nova Scotia households on average spent $7,527 on Food, $14,130 on Shelter, and $10,985 on transportation. The Canadian average household spending for food, shelter, and transportation were all higher. Nova Scotia households on average spent $4,408 on household operations, $1,773 on household furnishings , $2,824 on clothing and $3,221 on recreation. Compared to 2013, average household spending was down for several of the larger expenditure categories, including clothing and transportation. Food spending was up 7.5 per cent in 2014, shelter up 5.0 per cent, and household operations expendituers increased 8.6 per cnent.
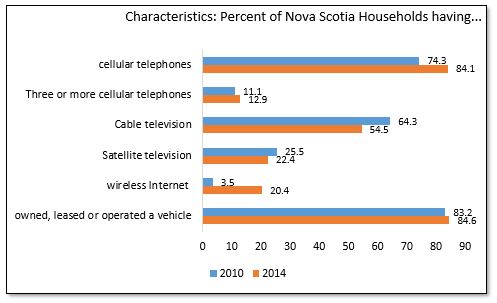
In addition to household consumption, total household spending also includes income taxes, personal insurance payments and pension contributions, and gifts of money, support payments, and charitable contributions. Income taxes constituted 17.6 percent of total household expenditures in 2013, lower than the national average (18.4%). The survey also describes characteristics such as household equipment, noting that cable and satellite television is on the decline compared to 2010, but wireless internet and the occurrence of cellular devices (often multiple per household) are on the rise.
Source: Cansim Table 203-0021 - 203-0028 and Statistics Canada, The Daily: Survey of Household Spending