For additional information relating to this article, please contact:
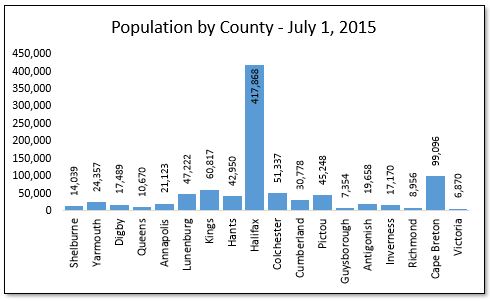
February 10, 2016NOVA SCOTIA POPULATION ESTIMATES BY COUNTY - JULY 1, 2015 As of July 1, 2015, Nova Scotia's population was an estimated 943,002, a 0.1 per cent population increase (+615 persons) over the estimated 2014 population.
Halifax County's population was an estimated 417,868 persons, a 1.0 per cent increase (+4,300 persons) over 2014.
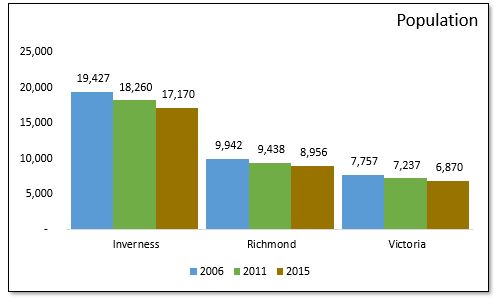
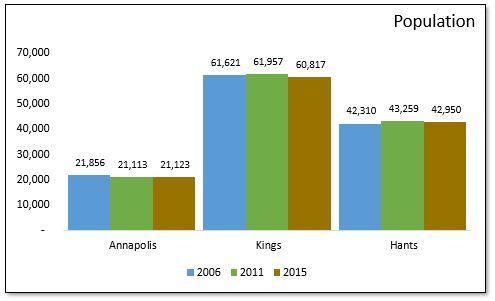
Between 2014 and 2015, only Halifax (+4,300) and Annapolis (+78) Counties saw population growth. In percentage terms, the county with the largest decline was Guysbrough County (-3.2% or -245 persons from 2014 to 2015). In raw terms, the largest population decline occurred in Cape Breton County, which declined by 999 persons to 99,096. The population of Cape Breton County has declined every year since 2002, with the exception of 2004 (note that Cape Breton County is not the only county to show annual declines; All counties except Hants, Halifax Colchester and Kings have shown on average declining population over the 2002 - 2015 period.)
Over the last ten years, the compound annual growth rate for provincial population has been growth 0.05 per cent per year. For Halifax, this figure is 0.91 per cent. Guysborough County has the largest decline, at an average annual decline of 2.39 per cent.
Halifax continues to grow faster than all counties outside of the Halifax area. Even in years where provincial population declines, Halifax continues to grow.
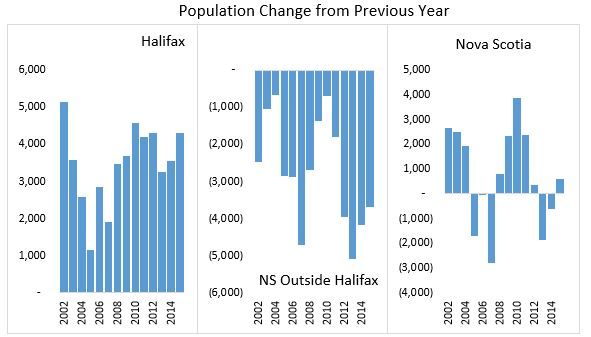
Population Change by County


Age Groups
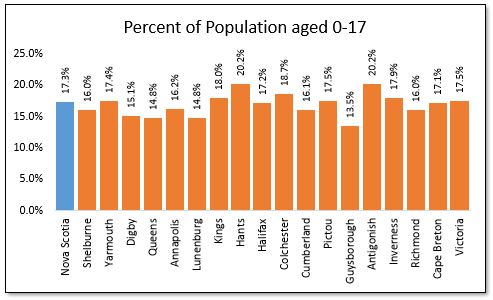
The largest percentage of youth aged 0-17 years old among its population in 2015 could be found in Hants and Antigonish Counties, at 20.2 per cent. Guysborough County had the lowest percentage of youth among its population, at 13.5 per cent. As a whole, the province of Nova Scotia has 17.3 per cent of its population in this age group.
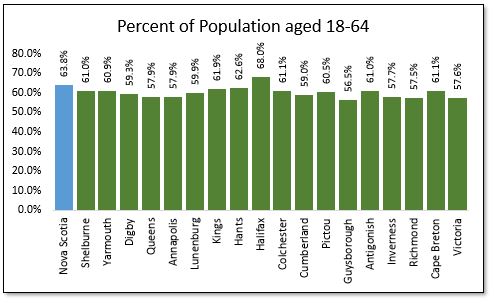
Halifax County has the largest percentage of population between the ages of 18 and 64 (68.0%), while Guysborough has the smallest (56.5%). Nova Scotia overall has 63.8 per cent of its residents in this age cohort.
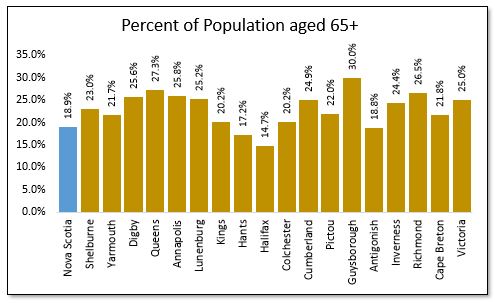
Looking at the seniors population (Aged 65 and over), the largest proportion by county is in Guysborough (30.0%), while the lowest proportion was in Halifax (14.7%). As a province, Nova Scotia has 18.9 per cent of its population in this age cohort.
Components
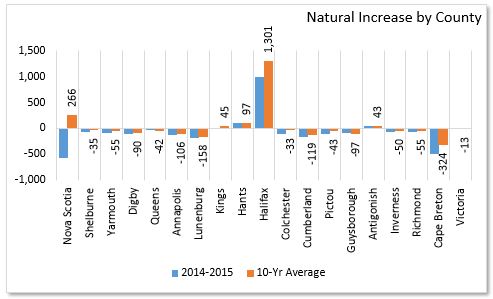
Natural Increase (births minus deaths) was positive in three Counties from 2014 to 2015: Halifax (+997), Hants (+110), and Antigonish (+47). The largest natural decrease was in Cape Breton (-483).
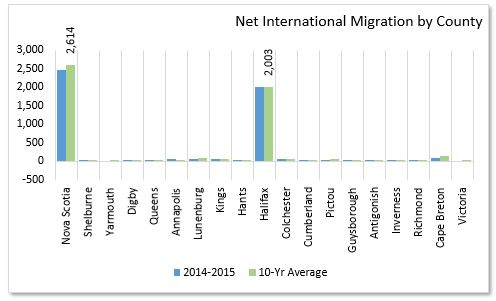
Net International migration (Immigrants - emigrants + returning emigrants - net temporary emigrants + net non-permanent residents) was +2,463 for the province in the year leading up to July 1, 2015. Among the counties, this measure was highest in Halifax (+2,005) and lowest in Victoria (-7). Over the last ten years, Halifax has averaged a positive 2,003 net international migrants.
Net Interprovincial migration was negative in all but three counties: Annapolis gained 124 persons, Cumberland gained 64, and Victoria gained 11. The County with the largest net interprovincial outmigration was Cape Breton, with -291 from 2014-2015. Interprovincial migration has seen a decline in the outflow in 2015 compared to 2014 for Halifax county.

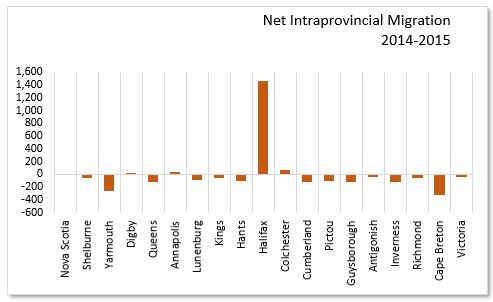
Net Intraprovincial migration was negative in all but four counties: Halifax gained 1,459 persons, Colchester gained 75, Annapolis gained 35 and Digby gained 5 persons. The County with the largest net intraprovincial outmigration was Cape Breton, with -317 from 2014-2015.
Census Metropolitan Areas
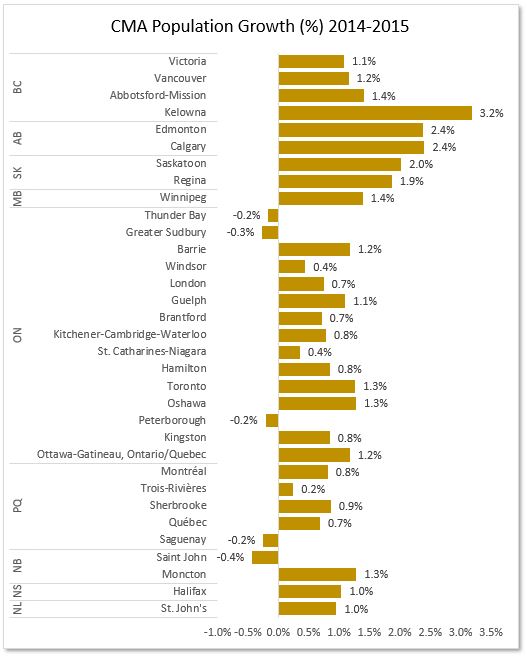
The Halifax CMA grew 1.0 per cent from 2014 to 2015. Among CMAs in Canada, highest growth in percentage terms was seen in Kelowna which grew 3.2 per cent, and Calgary and Edmonton which both grew by 2.4 per cent. Moncton NB and St John's NL grew by 1.3 per cent and 1.0 per cent respectively between 2014 and 2015, and the population of Saint John NB declined by 0.4 per cent.
Source: CANSIM Tables 051-0062 Census Division), 051-0063 (Components of Population growth), and 051-0056 (CMA)