For additional information relating to this article, please contact:
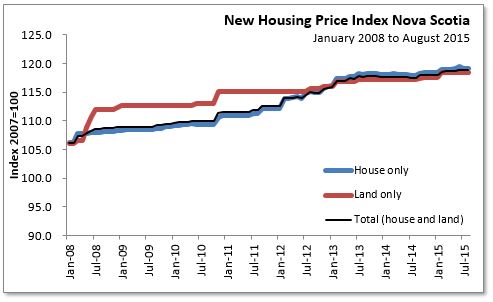
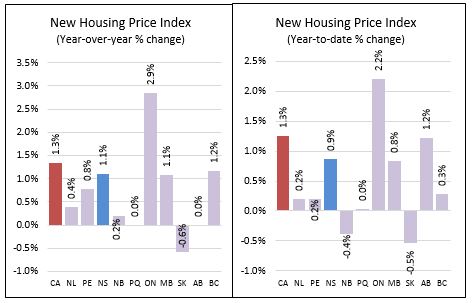
October 08, 2015NEW HOUSING PRICE INDEX, AUGUST 2015 In Nova Scotia August 2015, the new housing price index (2007=100) was unchanged at 118.8, a 1.1 per cent increase over August 2014. The Canadian index was up 0.3 per cent on a monthly basis (to 113.4), and was 1.3 per cent higher than a year ago.
In Nova Scotia, the price index for land was unchanged at 118.4, and was 1.0 per cent higher than a year ago. The price index for house (only) was also unchanged at 119.2, up 1.1 per cent compared to last August.
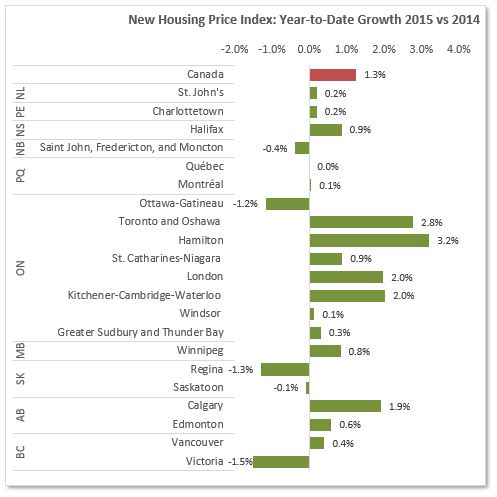
On a year-to-date basis to August 2015, the Canadian average rose 1.3 percent compared to the first eight months of 2014. This month, Ontario showed the largest year to date increase in new housing prices, at 2.2 per cent. New Brunswick and Saskatchewan both showed declines in year to date changes over the first eight months of 2014.
Nova Scotia's year to date house price index growth was 0.9 percent.
Among Census Metropolitan Areas tracked by the NHPI, Hamilton's new housing price index grew the most on a year-to-date basis, up 3.2 per cent in 2015 over the first eight months of 2014.
The CMAs in New Brunswick showed year to date decreases in new housing prices, while St. John's and Charlottetown posted small increases (0.2% for both). In western Canada, Saskatchewan's CMAS (Regina and Saskatoon dipped 1.3% and 0.1% respectively) posted declines, Calgary's price growth remained high while Edmonton's grew by 0.6 per cent. Vancouver prices rose slightly, up 0.4 per cent and Victoria's prices declined the most among CMAs, at -1.5 per cent in year to date terms.
Source Statistics Canada, CANSIM table 327-0046