For additional information relating to this article, please contact:
April 17, 2015ANALYSIS OF NOVA SCOTIA'S CONSUMER PRICE INDEX FOR MARCH 2015 At 0.5 per cent year over year, Nova Scotia's consumer price index was below the national average, with an increase of 1.2 per cent from March 2014 to March 2015. Monthly CPI increase for Nova Scotia was 1.3 per cent, above the national average of 0.7 per cent.
Within Atlantic Canada, PEI posted a year over year CPI decrease (-0.8%) while Newfoundland and Labrador (+0.4%), New Brunswick (+0.3%) and Nova Scotia (+0.5%) posted increases. Year-over-year CPI increases in the region were smaller than national average in part due to greater use of fuel oil in the region. Alberta year over year CPI declined 0.1 per cent as natural gas prices, which tend to be volatile in Alberta, fell 42.4 per cent in the province. Ontario had highest year over year CPI change, rising 1.6 per cent compared to March 2014.
Compared to Mach 2014, prices in Canada increased in seven of the eight major component categories led by higher prices for food followed by household operations, furnishings and equipment index and shelter index. The transportation index posted a year over year decline for the fifth consecutive month.

Nova Scotia's CPI excluding food and energy rose 1.8 per cent, lower than the national rate (2.0%) on a year over year basis but higher than February increase of 1.3 per cent. Price level gains for this index were highest in Alberta and Manitoba (both +2.4%) and lowest in British Columbia (+1.0%).

Main contributors to monthly (March 2015 vs. February 2015) NS CPI movement:
-Fuel oil and other fuels (+11.7%)
-Gasoline (+7.6%)
-Non-prescribed medicines (-5.4%)
-Preserved vegetables and vegetable preparations (-4.9%)
Main contributors to annual (March 2015 vs. March 2014) NS CPI movement:
-Fresh or frozen beef (+25.8%)
-Homeowners' home and mortgage insurance (+10.4%)
-Gasoline (-21.4%)
-Fuel oil and other fuels (-11.8%)
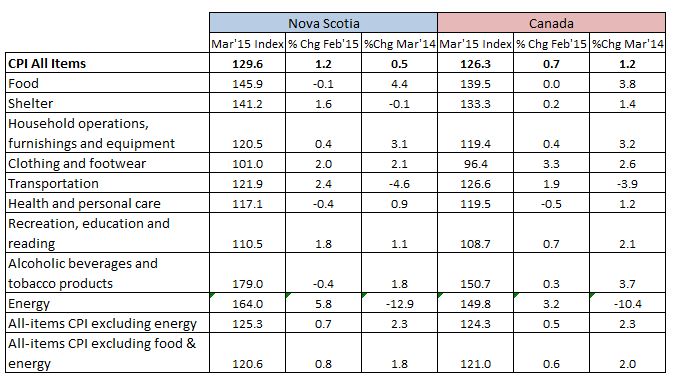
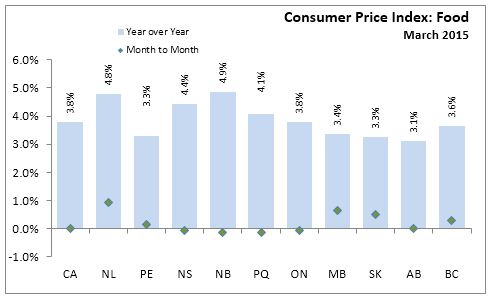
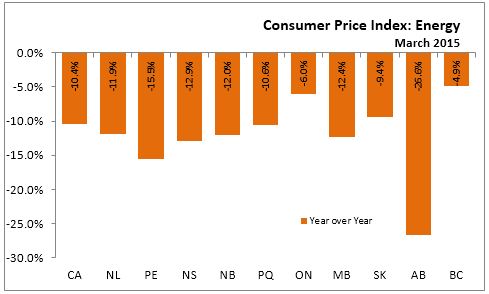
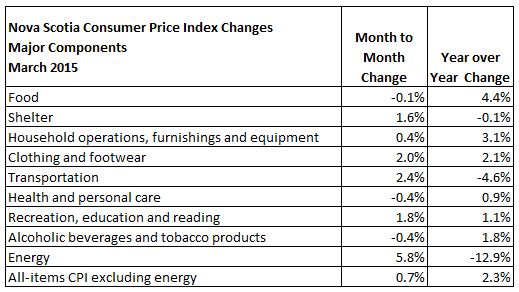
The CPI growth for food (year over year) in Nova Scotia was 4.4 per cent, and the energy index dipped 12.9 per cent compared to a year ago (see the following two charts). The Nova Scotia food index recorded a 0.1 per cent decline compared to the February 2015.
The following table shows the price increases specific to Nova Scotia for the major components of the CPI this month:
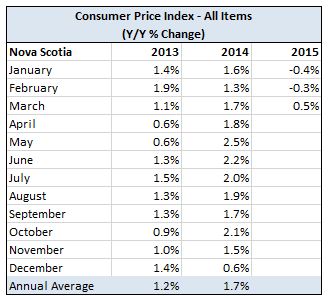
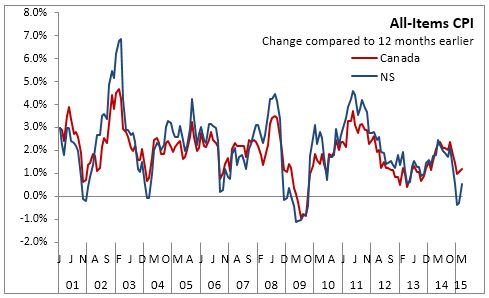
Long Run Trends
The recent year over year trend in the All-Items Consumer Price Index for Nova Scotia shows the annual CPI rate of change declining more than the national in recent month. For March 2015, the difference between the Canadian and Nova Scotia annual CPI rate is smaller than it was previous month. While month to month movements in the indices can be different, over time they continue to follow the same overall trend.
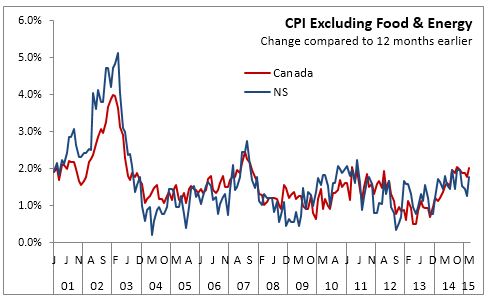
This month's year over year trend in CPI less food and energy shows Nova Scotia below the Canadian.
APPENDIX TABLES