For additional information relating to this article, please contact:
November 24, 2014NOVA SCOTIA NET TRADE 2013 
The trade data in the national economic accounts represent total, international, interprovincial trade in goods and services. From these data one can derive net trade, which is the difference between exports and imports.
At the higher levels of market aggregation, Nova Scotia usually reports more goods and services imports than exports. With rare exception, the trade balance is a trade deficit. At lower commodity and/or industry classification, there is a greater mix of trade activity with greater possibility of positive trade balances in some area, but these disaggregates are outside the scope of this analysis.
In the last twenty-one years, Nova Scotia trade deficits have increased in most markets. In some cases the impact is increasing and in others it is declining. The overall effect, however, is negative because total deficits are increasing. The trend of increasing deficits began before, but have been accelerated by the recession 2007-2009.
 Trade Deficit to GDP Ratio
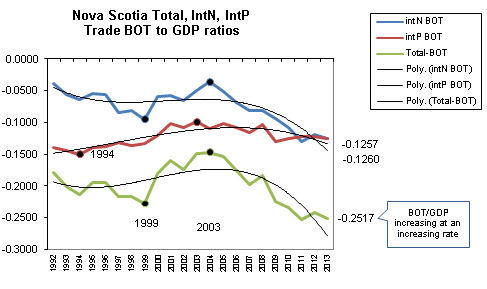
The trade deficit to GDP ratio provides a measure of how the trade deficit is performing in respect to growth in gross domestic product (GDP). If the ratio is increasing, then the deficit is growing faster than domestic production.
Over the period 2009 to 2013 international balance of trade deficit to GDP ratio decreased from -0.0938 to -0.1257 and the total balance of trade deficit to GDP ratio decreased from -0.2245 to -0.2517 -- indicating that these two deficits are increasing faster than GDP.
The interprovincial balance of trade deficit to GDP ratio increased from -0.1308 to -0.1206 indicating that over the period in the interprovincial sector the deficit is not increasing faster than production. Note that this positive note was insufficient to overcome the growth in international trade deficit growth.
Sectorial Net DeficitsOver the period 1992 to 2013, Nova Scotia's balance of trade (BOT) has been increasing. By 2007 the deficit began increasing at an increasing rate. By 2013 the annual deficit reached $9.9 billion. The international and the interprovincial trade sectors reported deficits in each year over the 1992-2013 period. Only international services trade has ever reported a surplus. In 2013, the international and the interprovincial deficits are roughly the same at $4.9 billion each.
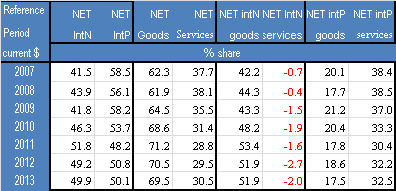
In the period 2009 to 2013, the international trade deficit increased $1.614 billion to $4.92 billion: from a 41.8% share to a 49.9% share of the deficit. The interprovincial trade deficit only increased by $321 million and the share of the deficit declined 58.2% to 50.1%.
In the period 2009 to 2013, the goods trade deficit increased $1.733 billion: from a 64.5% share to a 69.5% share of the deficit. The services trade deficit increased by $202 million: declining from a 35.5% share to a 30.5% share of the deficit.
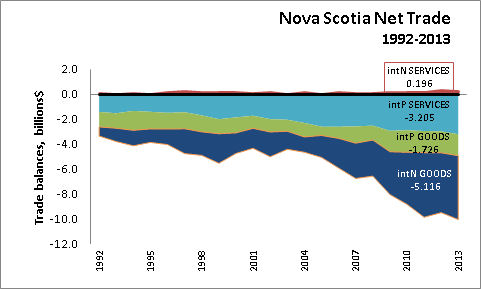
In 2013 the international goods trade deficit increased 6.7% to $5.116 billion; the interprovincial services trade deficit increased 7.7% to $3.205 billion; the interprovincial goods trade deficit increased 0.6% to $1.726 billion; and the international services trade surplus declined 20.6% to $196 million.
Computed from Statistics Canada CANSIM table
384-0038