The Economics and Statistics Division maintains archives of previous publications for accountability purposes, but makes no updates to keep these documents current with the latest data revisions from Statistics Canada. As a result, information in older documents may not be accurate. Please exercise caution when referring to older documents. For the latest information and historical data, please contact the individual listed to the right.
<--- Return to Archive
For additional information relating to this article, please contact:
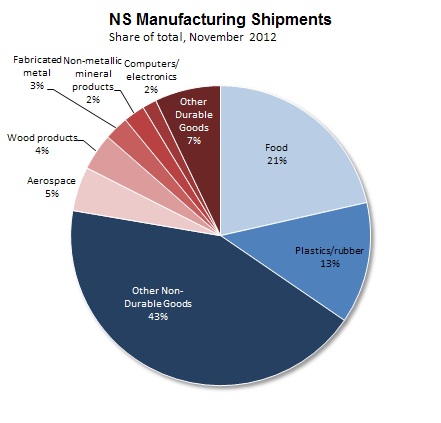
January 18, 2013MONTHLY SURVEY OF MANUFACTURING, NOVEMBER 2012 Nova Scotia’s manufacturing shipments (seasonally adjusted) fell 3.9% to $848 million in November 2012. The decline was mainly concentrated in non-durable goods (-7.5%), computer and electronic products (-4.5%), wood products (-4.4%), partially offset by increases in aerospace products and parts (+15.1%) and non-metallic mineral products (+6.6%).
Since November 2011, Nova Scotia’s manufacturing shipments were down 5.8%.
Canadian manufacturing shipments advanced 1.7% to $49.9 billion in November 2012, the highest level since May 2012. The largest gains were in the transportation equipment, primary metal and chemical industries. Compared to a year ago, Canadian manufacturing shipments were up 0.5% in November 2012.
TRENDS
On a year-to-date basis, Nova Scotia’s manufacturing shipments (Jan.-Nov. 2012) were down 2.6% compared to the same period last year. Newfoundland led the provinces in year-to-date (+35.8%) growth in the first eleven months of 2012. Nova Scotia’s manufacturing sales growth has been the slowest in the country.
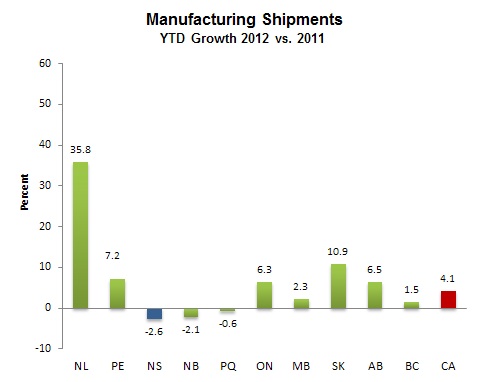
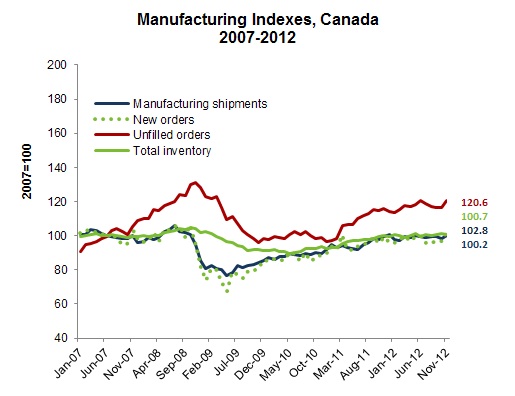
At the national level, year-to-date (Jan.-Nov. 2012) manufacturing shipments were up 4.1% compared to the same period in 2011. Other indicators of manufacturing activity also point to improvements over this period for Canada. New orders are up 2.8% in the first 11 months of 2012 compared to the same period last year. Unfilled orders are up 8.1%. Total inventory levels rose 3.5%, and the inventory-to-sales ratio was to 1.31 in November 2012, well below its peak of 1.65 in January 2009.
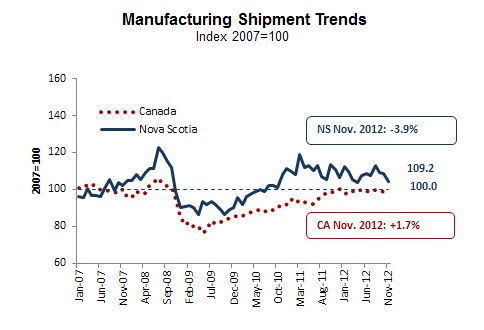
Compared with national data, Nova Scotia’s manufacturing shipments recovered more quickly from the recession. In November 2012, both Canadian and Nova Scotia’s manufacturing sales were back at pre-recession level (2007).
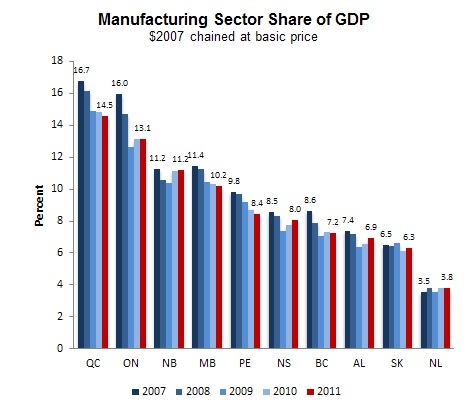
During the last five years, manufacturing sector contributions to the provincial GDP declined in all provinces except Newfoundland and Labrador, and New Brunswick. In Nova Scotia, the manufacturing sector share of GDP declined from its high of 11.2% in 2004 to 8.5% in 2007, and 8.0 % in 2011. In 2011, Quebec led the provinces in manufacturing sector contribution to the provincial GDP. Nova Scotia ranked the sixth among provinces in its manufacturing sector share of GDP in 2011.
Capital investment in Canadian manufacturing sector dropped from its peak of $20.6 billion in 2007 to $14.4 billion in 2009, but rebounded quickly in 2010 and 2011. In 2012, capital investment intentions in Canada’s manufacturing sector are estimated at $20.3 billion, only 1.7% below their peak in 2007.
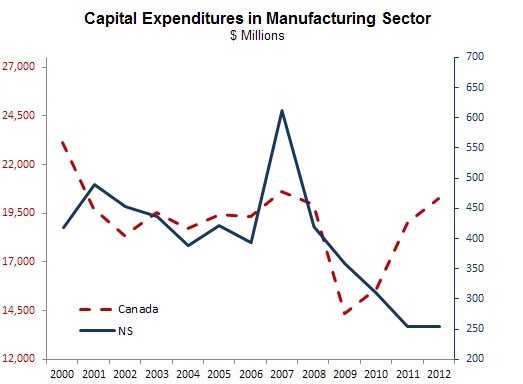
Capital investment in Nova Scotia’s manufacturing sector followed the similar trend, declining sharply from its peak of $612.1 million in 2007 to $254.2 million in 2011, but did not recovered to its 2007 level. In 2012, capital expenditure intentions in Nova Scotia’s manufacturing sector were estimated to remain flat at $254.5 million, 58.4% below their pre-recession peak in 2007.
Statistics Canada CANSIM tables: 304-0014, 304-0015, 377-0008.Summary Tables:
NS |
CA
<--- Return to Archive