The Economics and Statistics Division maintains archives of previous publications for accountability purposes, but makes no updates to keep these documents current with the latest data revisions from Statistics Canada. As a result, information in older documents may not be accurate. Please exercise caution when referring to older documents. For the latest information and historical data, please contact the individual listed to the right.
<--- Return to Archive
For additional information relating to this article, please contact:
March 14, 2024INFRASTRUCTURE ECONOMIC ACCOUNTS, 2023 Statistics Canada has released infrastructure economic accounts for 2023. These data report the stock of infrastructure, which is diminished by estimated depreciation and increased by investment in new capital. The data are reported for both public and private owners of infrastructure as well as by the type of asset and public service function it performs (categorized in the broad Classification of Functions of Government). Except where public and private infrastructure are explicitly reported, this analysis focuses primarily on infrastructure by function performed, which includes both public and private infrastructure.
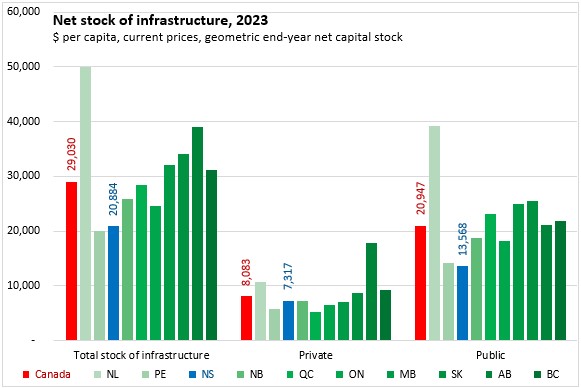
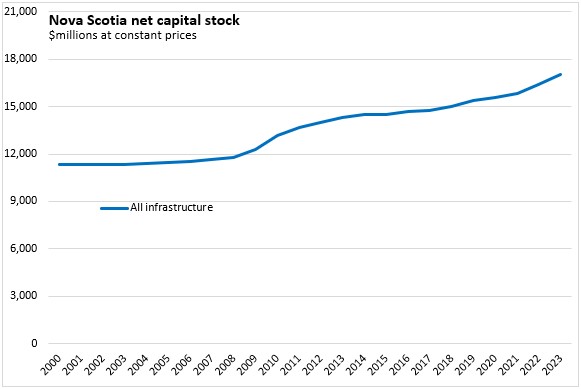
At the end of 2023, Nova Scotia's infrastructure net capital stock was $22.1 billion or $20,884 per person. Nationally, infrastructure net capital stock was $1,164 billion or $29,030 per person. Newfoundland and Labrador and Prairie Provinces had the highest per capita infrastructure stock at the end of 2023.
Public infrastructure assets make up 65.0% of infrastructure in Nova Scotia - the second lowest public share among provinces (only ahead of Alberta).
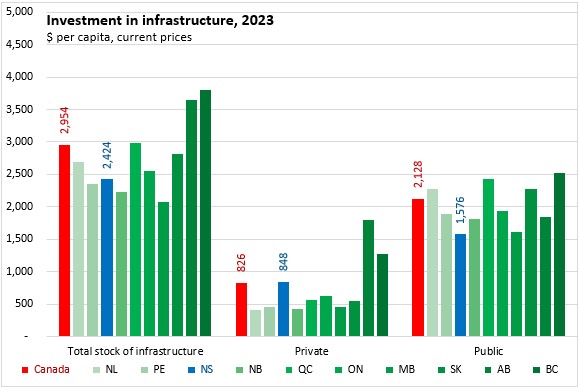
In 2023, a total of $2.566 billion in investments in infrastructure were made in Nova Scotia ($2,424 per capita). Nationally, investment in infrastructure was $2,954 per capita. Alberta and British Columbia reported the highest per capita investments in infrastructure while Manitoba reported the least investments. Investment in public infrastructure accounted for 65.0% of Nova Scotia's investment in infrastructure in 2023, the second lowest public share after Alberta.
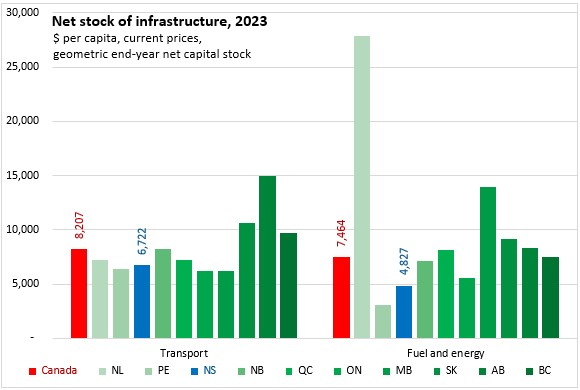
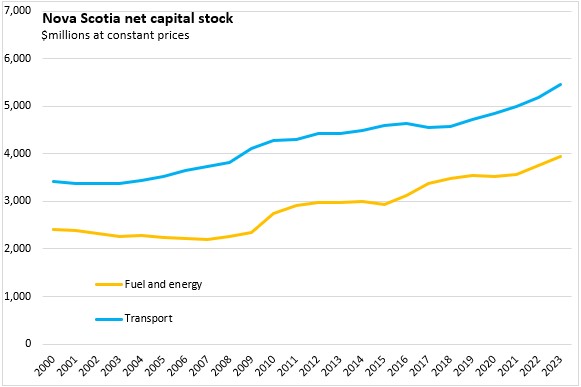
Across Canada, transportation infrastructure (roads, bridges, canals, rails, ports, airports, pipelines) accounts for the largest portion of the stock of infrastructure: $8,207 per capita. Nova Scotia had less transportation infrastructure per capita at $6,722 in 2023.
Fuel and energy infrastructure (primarily power generation and transmission) accounts for the next largest category of infrastructure by function. Nationally, there was $7,464 in fuel and energy infrastructure per capita with the largest amounts in Newfoundland and Labrador and Manitoba. Nova Scotia's fuel and energy infrastructure capital stock was $4,827 per capita - the second lowest among provinces after Prince Edward Island.
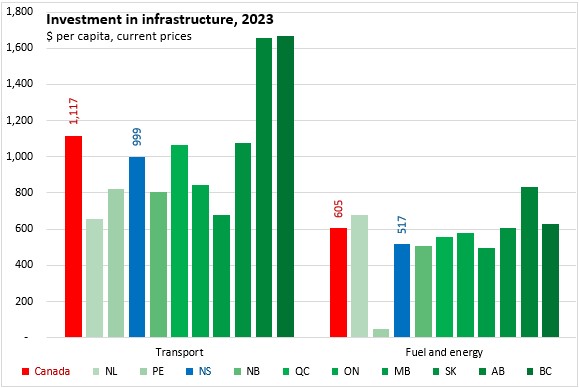
Nova Scotia's 2023 investment in new transportation infrastructure amounted to $999 per capita - below the national average of $1,117 per capita. The highest investments in transport infrastructure were in Alberta and British Columbia. The lowest investments in transport in 2023 were in Manitoba and Newfoundland and Labrador.
Nova Scotia had $517 per capita in investment in fuel and energy infrastructure. Nationally, investment in fuel and energy infrastructure was $605 per capita with the highest investment in Alberta and the lowest in Prince Edward Island.
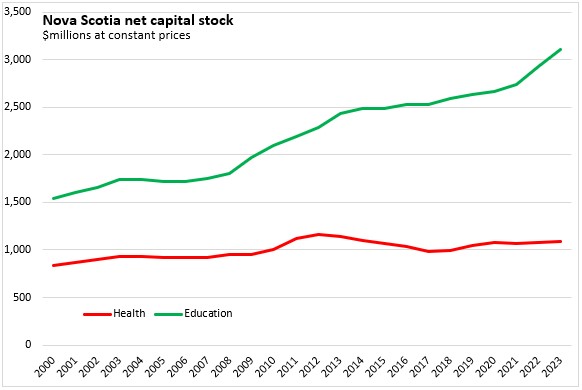
Education (primarily schools, universities, colleges) and health care (hospitals, nursing/residential care buildings) were the next two largest categories of infrastructure by function.
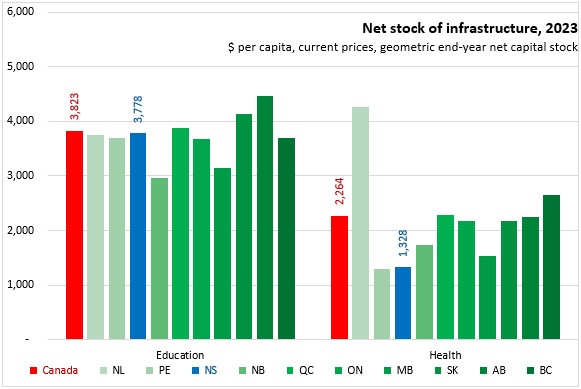
Nova Scotia's education infrastructure amounted to $3,778 per capita in 2023, just below the national average of $3,823 per capita. Education infrastructure was highest in Alberta and lowest in New Brunswick.
Health infrastructure in Nova Scotia was the second lowest per capita at $1,328. Nationally, there was $2,264 per capita in health infrastructure, with the highest amount in Newfoundland and Labrador.
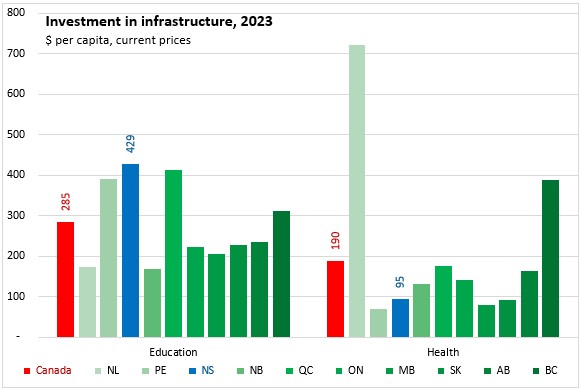
Nova Scotia's investment in education infrastructure was the highest among provinces in 2023 at $429 per capita. Across Canada, there were $285 per capita worth of investments made in education infrastructure in 2023. Newfoundland and Labrador and New Brunswick had the lowest per capita investment in education infrastructure while Newfoundland and Labrador had the highest.
Nova Scotia investment in health infrastructure was $95 per capita, which was half the national average of $190 per capita. Newfoundland and Labrador reported the largest per capita investments in health infrastructure. The lowest amount of per capita health infrastructure investment was reported in Manitoba and Prince Edward Island.
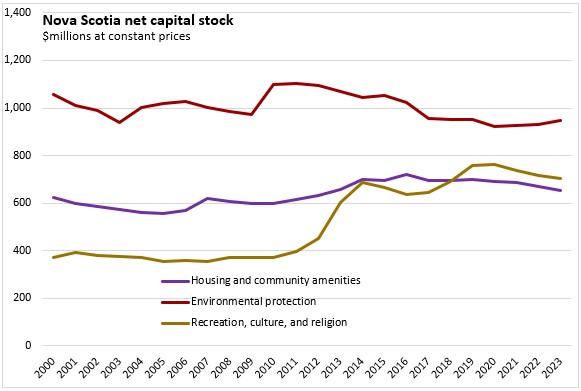
The next three largest categories of infrastructure capital stock by function were: environmental protection (primarily wastewater collection and treatment), housing and community amenities (primarily water infrastructure), and recreation/culture/religion (mostly sport/recreation facilities - both indoor and outdoor).
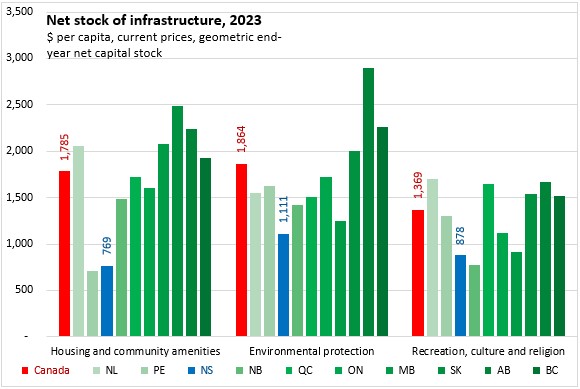
Nova Scotia has the second lowest per capita stock of housing and community amenities (ie: water) at $769 and the lowest per capita stock in environmental protection infrastructure (ie: wastewater) at $1,111. Saskatchewan had the highest housing/community per capita stock and Alberta had the highest per capita stock in environmental/wastewater infrastructure.
Nova Scotia's recreation infrastructure amounted to $878 per capita in 2023, the second lowest among provinces (ahead of New Brunswick). National average recreational capital stock was $1,369 per capita in 2023. Alberta, Québec and Newfoundland and Labrador reported the highest per capita recreational capital stock.
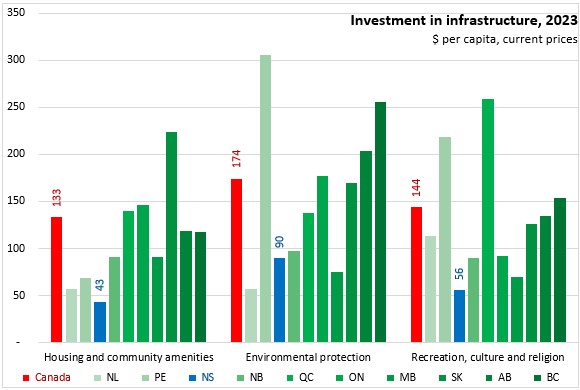
Nova Scotia's per capita investments in housing/water infrastructure ($43 per capita) was the lowest among provinces. Nova Scotia's investment in environmental/wastewater infrastructure ($90 per capita) was below the national average. Saskatchewan reported the largest investments per capita in housing/water while Prince Edward Island reported the highest per capita investments in environmental/wastewater infrastructure. Newfoundland and Labrador reported the lowest investments per capita in environmental/wastewater infrastructure.
Nova Scotia's investment in recreation infrastructure was $56 per capita, the lowest among provinces. National average investment in recreational infrastructure was $144 per capita in 2023. Québec reported the largest per capita investments in recreation infrastructure.
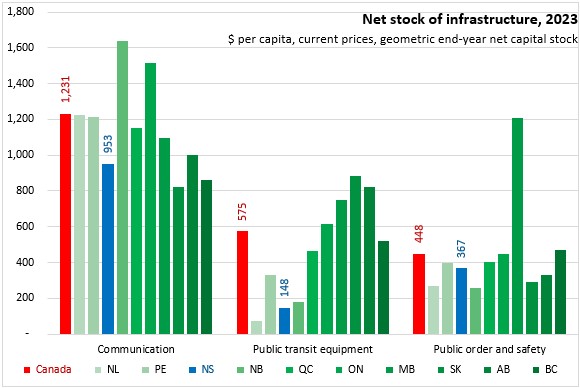
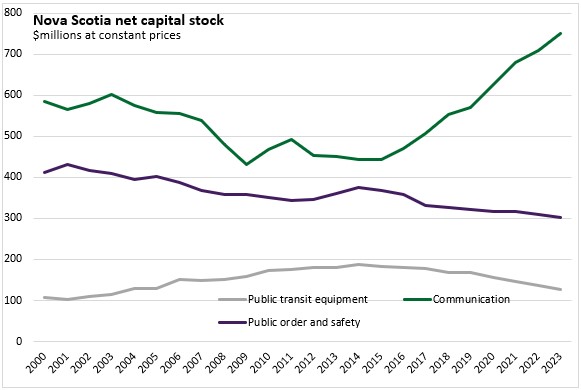
Infrastructure for communications (cables, structures), public transit (buses, rolling rail stock) and public order/safety buildings had the smallest value of per capita stocks as reported by public service function.
Nova Scotia reported communications infrastructure stock of $953 per capita. National communications infrastructure per capita was $1,231 with the highest amount in New Brunswick.
Nova Scotia's public transit equipment stock was $148 per capita in 2023. The Atlantic provinces had the lowest per capita value of public transit infrastructure. Nationally, there was $575 in public transit infrastructure per capita. The highest amounts were in the prairie provinces.
Nova Scotia had $367 per capita in public order and safety infrastructure in 2023. This was below the national average of $448 per capita. The highest public order and safety infrastructure per capita was in Manitoba and the lowest in New Brunswick.
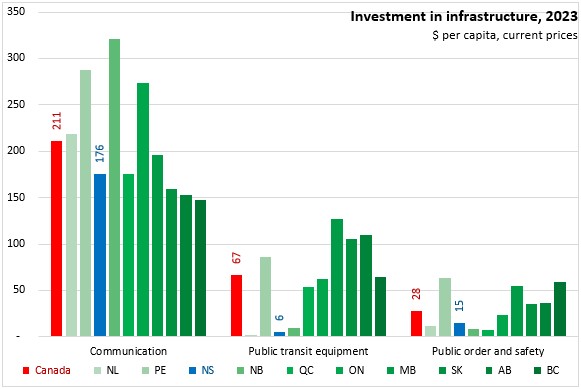
Nova Scotia reported lower than national average investments per capita in communications ($176 per capita), public transit ($6 per capita) and public order and safety ($15 per capita) in 2023. Communications investment was highest in New Brunswick and lowest in British Columbia. Public transit investments per capita were highest in the prairie provinces and lower in Newfoundland and Labrador, Nova Scotia and New Brunswick. Public order and safety investments per capita were highest in Prince Edward Island and lowest in Québec.
When measured at constant prices, the stock of Nova Scotia infrastructure assets remained largely stable from 2000 to 2008. Since then, there has been mostly steady increases in the stock of infrastructure in Nova Scotia (except 2015).
Transportation infrastructure in Nova Scotia has been rising steadily, with accelerated growth since 2019. Fuel and energy infrastructure exhibits periods of rapid increases (2009-2010, 2015-2017 and 2021-2023), typically followed by periods of a stable stock of infrastructure.
Nova Scotia's education infrastructure has risen substantially since 2008 and particularly since 2020. Health infrastructure stock declined from 2012 to 2017 (including depreciation), but has stabilized.
Nova Scotia's housing (ie: water) infrastructure has been on a slow decline since 2016. Environmental (ie: wastewater) infrastructure values trended down from 2012 to 2020, but have edged up lately. Recreation infrastructure increased substantially from 2010 to 2014 and again from 2016 to 2020, but has fallen in the years since.
Communications infrastructure trended down in most years from 2003 to 2015 (except 2010 and 2011). There were substantial increases in Nova Scotia's communications infrastructure stock from 2015 to 2023.
Nova Scotia's public transit equipment stock declined (in real terms) from 2014 to 2023.
The stock of Nova Scotia's public order and safety building infrastructure has generally trended down since 2014.
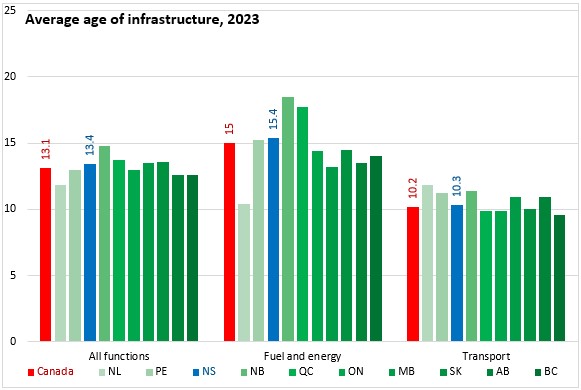
Infrastructure can also be measured by the "average age" of the assets used in public service functions. The average age of all infrastructure in Nova Scotia was 13.4 years in 2023, above the national average of 13.1 years. The oldest infrastructure in Canada was reported in New Brunswick while the newest was reported in Newfoundland and Labrador.
Nova Scotia's fuel and energy infrastructure (mostly electric power generation and transmission) had an average age of 15.4 years in 2023, which was above the national average age of 15.0 years. The oldest fuel and energy infrastructure was in New Brunswick and the newest in Newfoundland and Labrador.
Nova Scotia's transport infrastructure had an average age of 10.3 years in 2023, just above the national average of 10.2 years. Newfoundland and Labrador had the oldest transport infrastructure while British Columbia had the newest.
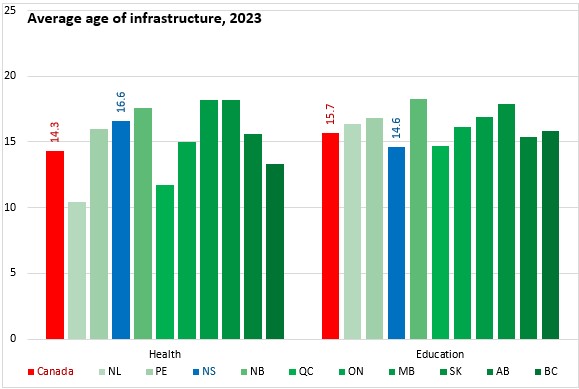
Nova Scotia's health infrastructure (hospitals, nursing/residential care facilities) had an average age of 16.6 years, which was above the national average of 14.3 years. New Brunswick, Saskatchewan and Manitoba had the oldest health infrastructure while Newfoundland and Labrador and Quebec had the newest.
Nova Scotia's education infrastructure (schools, colleges, universities) had an average age of 14.6 years in 2023, which was the newest among provinces (national average: 15.7 years). New Brunswick and Saskatchewan had the oldest education infrastructure in 2023.
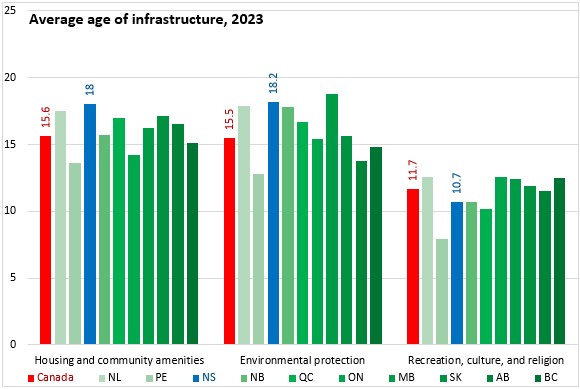
Nova Scotia's housing/water infrastructure (18.0 years) was the oldest among provinces. Nova Scotia's environmental/wastewater (18.2 years) infrastructure assets were the second oldest among provinces (after Manitoba). Nova Scotia's recreational facilities had an average age of 10.7 years - newer than the national average (11.7 years). Prince Edward Island reported the newest infrastructure for housing/water, environmental/wastewater and recreational facilities. Manitoba reported the oldest environmental/wastewater infrastucture while Ontario, Maniobta and British Columbia reported the oldest recreational infrastructure.
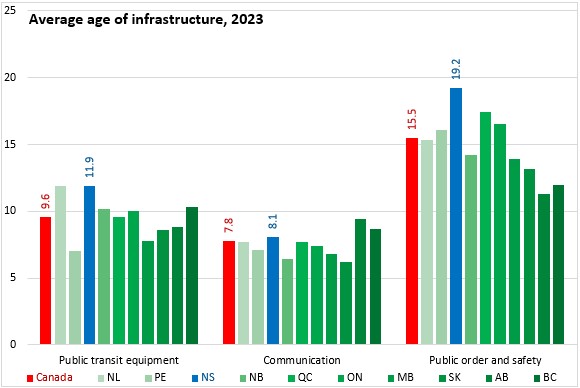
Nova Scotia's infrastructure for public transit equipment (11.9 years) and public order and safety (19.2 years) were the oldest among provinces. Nova Scotia's communications infrastructure had an average age of 8.1 years - the third oldest after Alberta and British Columbia.
Nationally, public transit equipment had an average age of 9.6 years with the newest infrastructure in Prince Edward Island. Communications infrastructure had an average age of 7.8 years across Canada with the newest infrastructure in Saskatchewan. Public order and safety building infrastructure had an average age of 15.5 years, with the newest infrastructure in Alberta.
Notes: Infrastructure is defined as physical structures and systems that support the production of goods and service and their delivery to and consumption by governments, business and citizens. Infrastructure assets are tangible assets that generally enable or perform a support function and includes both economic asset (i.e. highways, road, energy generation/transmission, sewage systems) and social assets (i.e. hospitals, schools, pollution abatement, recreation facilities, law enforcement facilities). The value of the capital stock is measured using perpetual inventory method where investment are positive flows that accumulated the asset which is depreciated over time as assets age. Assets in the data can be separated by purchasing sector, asset type, or function. Infrastructure assets do not include all types of non-residential assets, for instance buses and trains are included while some other types of mobile assets (defense ships, aircraft, ambulances) are not considered part of infrastructure assets.
Source: Statistics Canada. Table 36-10-0608-01 Infrastructure Economic Accounts, investment and net stock by asset, industry, and asset function (x 1,000,000); Table 36-10-0610-01 Infrastructure Economic Accounts, economic impact by asset, industry, and asset function (x 1,000,000); Table 36-10-0611-01 Infrastructure Economic Accounts, average age and remaining useful service life ratio by asset and asset function
<--- Return to Archive