The Economics and Statistics Division maintains archives of previous publications for accountability purposes, but makes no updates to keep these documents current with the latest data revisions from Statistics Canada. As a result, information in older documents may not be accurate. Please exercise caution when referring to older documents. For the latest information and historical data, please contact the individual listed to the right.
<--- Return to Archive
For additional information relating to this article, please contact:
March 14, 2024MANUFACTURING SHIPMENTS, JANUARY 2024 Monthly (seasonally adjusted, January 2024 vs December 2023)
Nova Scotia's manufacturing shipments increased 3.9% to $942 million. National shipments increased 0.2% to $71.1 billion.
Manufacturing shipments were up in 7 of 10 provinces, Newfoundland and Labrador had the largest reported gain. British Columbia had the largest reported decline.

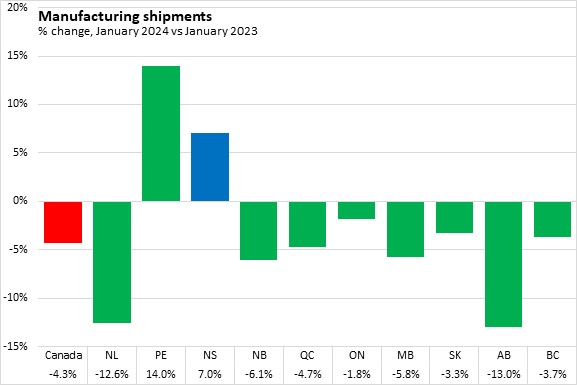
Year-over-year (January 2024 vs January 2023)
Nova Scotia's manufacturing shipments increased 7.0%. National shipments decreased 4.3%.
Manufacturing shipments were down in 8 out of 10 provinces. Prince Edward Island reported the largest gain while Alberta, and Newfoundland and Labrador posted the largest declines.
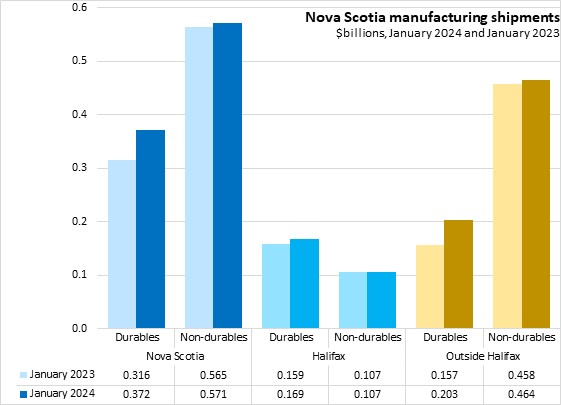
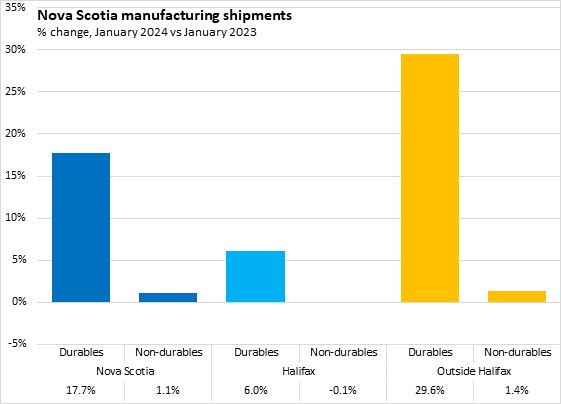
Nova Scotia's durable goods shipments increased 17.7%, while non-durable goods shipments increased 1.1%. In Halifax, durable goods shipments increased 6.0%, while non-durables decreased 0.1%. Outside Halifax, durable goods shipments increased 29.6%, while non-durables increased 1.4%.
Trends
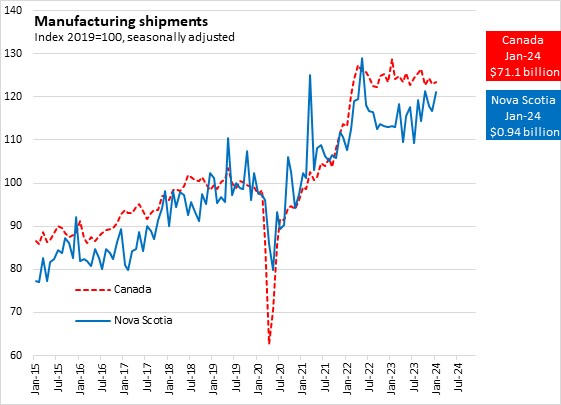
After a period of rising shipments, including a particular strong May 2022, Nova Scotia manufacturing shipments declined in the second half of 2022. Periodic spikes in Nova Scotia's shipments values are not uncommon. Throughout the last twelve months, Canada manufacturing shipments have generally shown a relatively flat trend and Nova Scotia shows steady improvement. Relative to 2019, Canada manufacturing shipments are maintaining a higher level than Nova Scotia, but the gap is shrinking.
Statistics Canada. Table 16-10-0047-01 Manufacturers' sales, inventories, orders and inventory to sales ratios, by industry (dollars unless otherwise noted); Table 16-10-0048-01 Manufacturing sales by industry and province, monthly (dollars unless otherwise noted) (x 1,000); Table 16-10-0011-01 Manufacturing sales, by industry for 12 Selected Census Metropolitan Areas (x 1,000)
<--- Return to Archive