The Economics and Statistics Division maintains archives of previous publications for accountability purposes, but makes no updates to keep these documents current with the latest data revisions from Statistics Canada. As a result, information in older documents may not be accurate. Please exercise caution when referring to older documents. For the latest information and historical data, please contact the individual listed to the right.
<--- Return to Archive
For additional information relating to this article, please contact:
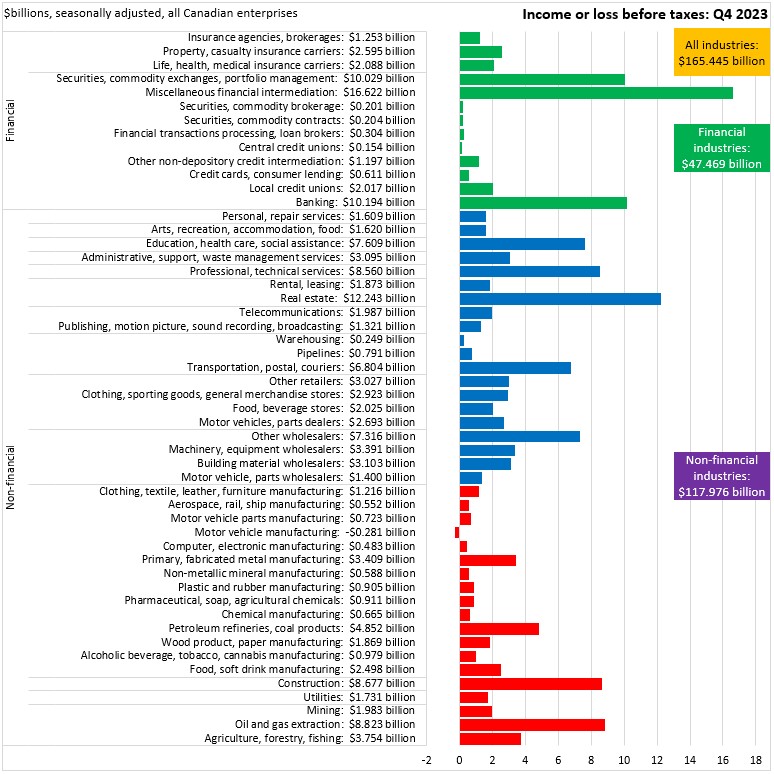
February 23, 2024CANADA FINANCIAL STATISTICS FOR ENTERPRISES, Q4 2023 In Q4 2023, Canadian enterprise net income before taxes (seasonally adjusted) was $165.445 billion. All broad industry categories reported positive income before taxes in Q4 2023 with the exception of motor vehicle manufacturing. The largest values of net income before taxes were reported in miscellaneous financial intermediation ($16.622 billion), real estate ($12.243 billion), banking ($10.194 billion) and securities/exchanges/portfolio management ($10.029 billion), oil/gas extraction ($8.823 billion), construction ($8.677 billion) and professional/technical services ($8.56 billion).
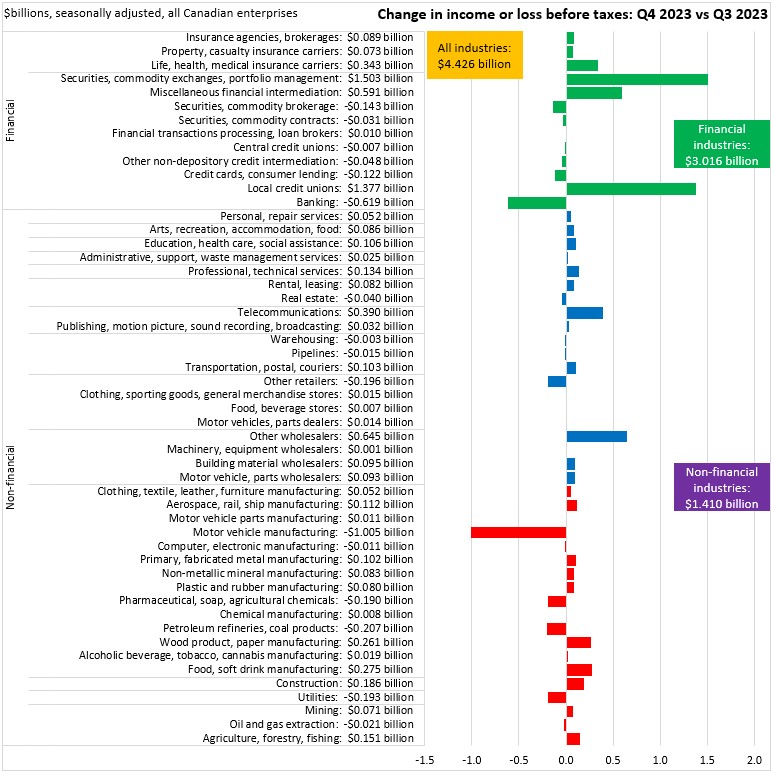
Compared with Q3 2023, net income before taxes increased by $4.426 billion across all industries. The increase was $3.016 for financial/insurance industries and $1.41 billion for non-financial industries. Securities/exchanges/portfolio management and credit unions reported the largest gains in net income before taxes. Motor vehicle manufacturing and banking reported the largest declines in net income before taxes.
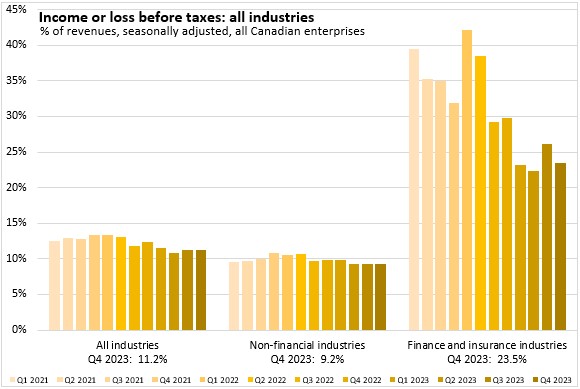
Measured as a share of revenue, income before taxes averaged 11.2% across all industries; 23.5% for financial industries and 9.2% for non-financial industries. Income as a share of revenues was little changed for non-financial industries and down for financial industries.
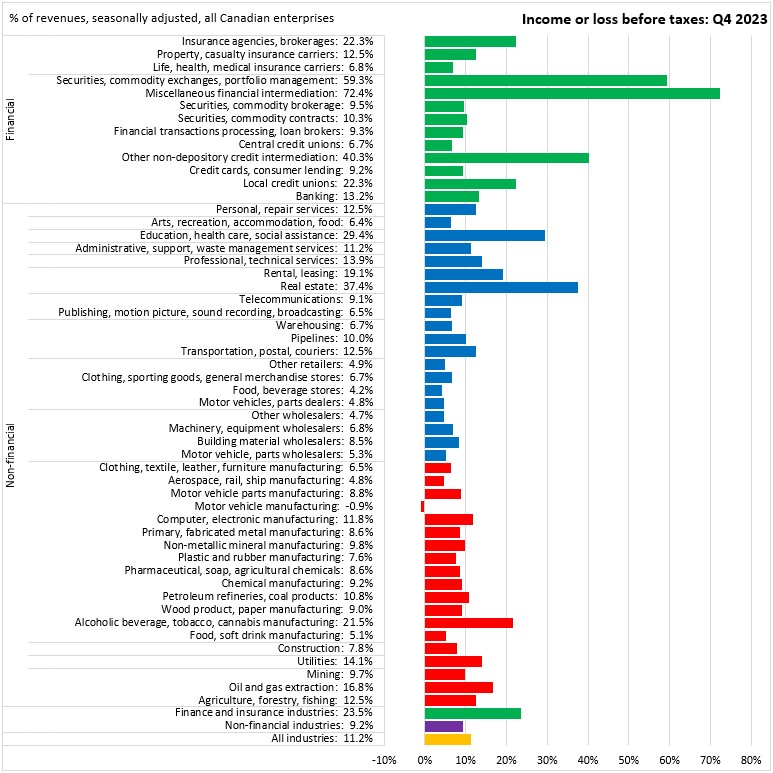
Measured as a share of revenue, income before taxes was highest in miscellaneous financial intermediation (72.4% of revenues), followed by securities/exchanges/portfolio management (59.3%), other non-depository credit intermediation (40.3%), credit unions (22.3%) and insurance agencies/brokerages (22.3%). Outside of financial industries, income before taxes as a share of revenue was highest in: real estate (37.4%), education/health/social assistance (29.4%, including daycares), alcohol/tobacco/cannabis manufacturing (21.5%), rentals/leasing (19.1%), oil/gas extraction (16.8%), utilities (14.1%) and professional/technical services (13.9%).
Source: Statistics Canada. Table 33-10-0226-01 Quarterly balance sheet and income statement, by industry, seasonally adjusted (x 1,000,000)
<--- Return to Archive