The Economics and Statistics Division maintains archives of previous publications for accountability purposes, but makes no updates to keep these documents current with the latest data revisions from Statistics Canada. As a result, information in older documents may not be accurate. Please exercise caution when referring to older documents. For the latest information and historical data, please contact the individual listed to the right.
<--- Return to Archive
For additional information relating to this article, please contact:
October 24, 2017STUDY: BANK OF CANADA COMMODITY PRICE INDEX, 1870-2016 A new Statistics Canada study, "A Long-run Version of the Bank of Canada Commodity Price Index, 1870 to 2015," places the recent movements in commodity prices in a 145-year historical perspective. Canada is a trading nation that produces significant quantities of resource outputs. Consequently, the behaviour of resource prices that are important for Canada is germane to understanding the progress of real income growth and the prosperity of the country and the provinces. Demand and supply shocks or changes in monetary policy in international markets may exert significant influence on resource prices, and their fluctuations constitute an important avenue for the transmission of external shocks into the domestic economy.
Net Export Trade as a % of GDP
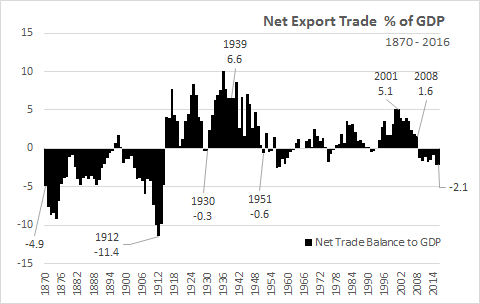
In the period 1870 to the start of World War 1, Canada was a small agrarian nation. The Canadian Net Trade to GDP profile is characterized by long periods of negative trade balances.
In the period 1914 to 1950, Canada reported positive international trade balances in all years , with the exception of 1930.
After 1950, international trade has been characterized by intermittent period of trade expansion and trade contraction. In 2009, with the collapse of the global trade market, Canada entered a period of negative trade balances.
Commodity Prices
Over the 145 years covered by the study, the importance of particular commodities for the Canadian economy evolved as new technologies and infrastructure permitted the use of an expanding set of commodities. This study shows that overall commodity prices exhibited a number of long cycles, with important differences in the variability in growth patterns across individual commodity groups.
While the study defines four periods (cycles), for clarity, we have compressed the long run cycles of commodity price changes into two general periods: 1870-1950 and 1951 to 2016. The Bank of Canada Commodity Price Index (BCPI), 1972=100.
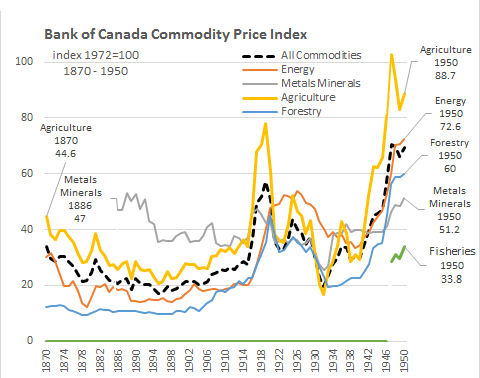
In the period 1870 to 1950, the commodity price index was relatively flat compared to the overall period of study.The main commodity group, in this first period, was Agriculture.
In 1870 the BCPI Agriculture price index was 44.6 (BCPI 1972=100), less than half of the BCPI in 1972. Between 1870 and 1895, the BCPI Agriculture price index was in a slow decline. Between 1895 and 1914, the BCPI Agriculture index was slowly increasing. During the period of the First World War, Agriculture prices took a sharp increase to a high of 78.1, followed by a sharp decline to a low of 35.4 in 1923. After 1923, the BCPI Agriculture prices increased and then declined sharply, during the Depression, to a low of 16.7 (1932). What followed next was the buildup to World War 2 and the post war years. The BCPI Agriculture commodity price index increased sharply to a new high of 102.6 in 1947. A four fold increase over 1932.
"Agriculture prices had the largest amplitude from 1900 to 1945, mainly due to the relatively larger changes in agriculture prices during the Great Depression of 1929."
Other commodities followed a similar, but less dramatic change over the same period. In 1947, Fisheries, as a commodity was added to the mix.
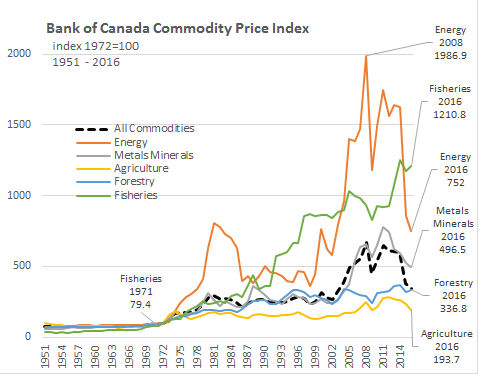
After 1950, prices continued to fluctuate, but after 1971, commodity prices changes were more dramatic.
In 1947, Fisheries data became available, entering the market at 79.4 (BCPI 1972=100). By 2016, the index had increased to 1210.8. Meanwhile, the BCPI Agriculture price index increased from 102.6 (BCPI 1972=100) to 193.7 over the same period.
The BCPI Energy price index was reported as 70.6 (BCPI 1972=100), and increased gradually to 808 in 1981, before declining to 360.4 in 1998. The BCPI Energy price index increased sharply between 1998 and 2008, reaching a new BCPI Energy price index high of 1986.9 (BCPI 1972=100). Between 2008 and 2016, the BCPI Energy price index declined, recovered then declined sharply to 752 in 2016.
"Energy prices had the largest amplitude cycles after 1945, and these were the largest amplitudes overall. This reflects both the large energy shocks of the 1970s and 1980s and the large energy cycle of the 2000s, as well as the sharp declines in energy prices that followed each period of growth."
Notes:
Energy commodity group prices: for Coal (1870 to 1972); Natural gas (1919 to 1972); Crude petroleum (1870 to 1972).
Metals and minerals commodity group (Gold, Silver, Nickel, Copper, Aluminum, Zinc, Lead, Iron, Potash) prices: Range from 1870-1971, 1900-1972.
Forestry commodity group (Lumber, Pulp, Newsprint: Prices from 1870-1973, 1875-1973, 1890-1947 respectively.
Agriculture commodity group (Cattle and calves, Hogs, Wheat, Barley, Canola, Corn, Potatoes): Prices from 1870-1973 except for Canola 1949-1973.
Fisheries commodity group only includes FINFISH. Prices are for 1908 to 1972. Values for 1947 to present.
SOURCES:
STC Daily October 11, 2017.
Analytical Studies Branch Research Paper Series (Catalogue number11F0019M),
Statistics Canada Study: A Long-run Version of the Bank of Canada Commodity Price Index
CANSIM 383-0027.. 383-0028
<--- Return to Archive