The Economics and Statistics Division maintains archives of previous publications for accountability purposes, but makes no updates to keep these documents current with the latest data revisions from Statistics Canada. As a result, information in older documents may not be accurate. Please exercise caution when referring to older documents. For the latest information and historical data, please contact the individual listed to the right.
<--- Return to Archive
For additional information relating to this article, please contact:
July 24, 2017POLICE REPORTED CRIME STATISTICS, 2016 Statistics Canada has released the 2016 results for police-reported crime statistics collected under the Uniform Crime Reporting Survey. This report measures incidents of crime, crime rates (per 100,000 population), and crime severity (based on sentencing data) by types of crime. Data are available for Canada, provinces and Census Metropolitan Areas.

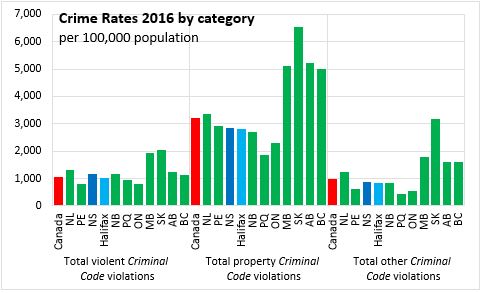
Canada's crime rate(Criminal Code violations excluding traffic) was 5,224 incidents per 100,000 population. In comparison, Nova Scotia's crime rate for 2016 was 4,879 per 100,000 population. Nova Scotia’s total crime rate was below the national rate for the second consecutive year following nearly two decades above the national rate. Halifax's crime rate was below the national and provincial rates at 4,663 incidents per 100,000 population.
Property crimes accounted for the majority of crimes - for Nova Scotia 2,843 offences per 100,000 population in 2016. Property crimes accounted for 58 per cent of total Criminal Code violations (excluding traffic) while violent crimes accounted for 24 per cent. Among the provinces, property crime rates were lowest in Quebec and Ontario and highest in Saskatchewan. Violent crime rates were lower in Prince Edward Island, Quebec, and Ontario and highest in Saskatchewan and Manitoba.
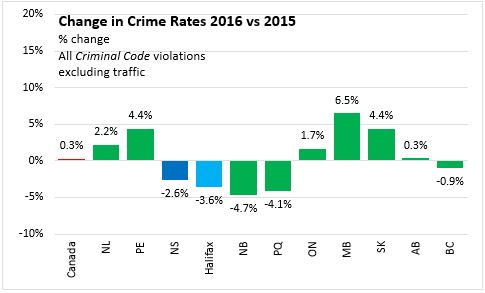
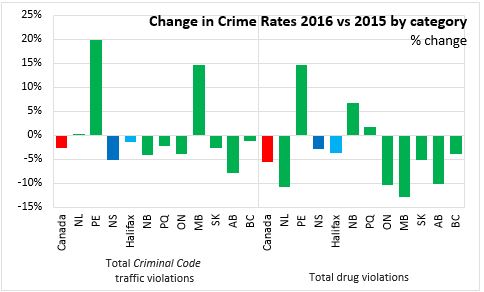
Canada's crime rates (Criminal Code, excluding traffic) were virtually unchanged, rising slightly on average in 2016. This second consecutive year of increasing crime rates for Canada, following declining rates for the 11 years before 2015. Nationally, the crime rate was up 0.3 per cent and similar to the level observed in 2013. Among provinces, the crime rate is down only in Nova Scotia, New Brunswick, Quebec, and British Columbia.
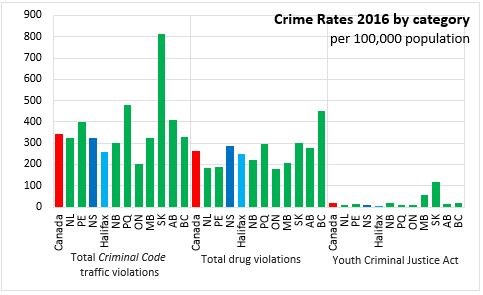
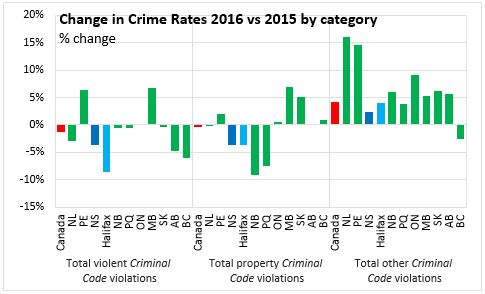
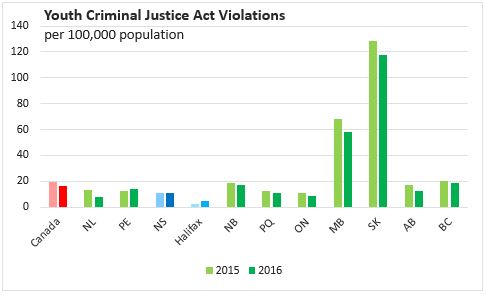
Nova Scotia's rate declined 2.6 per cent with a 3.6 per cent decline in Halifax. This is the sixth consecutive year of crime rate decline for the province and for Halifax. The province's total, violent, property, Criminal Code traffic violations, and drug crime rates are down. In Nova Scotia in 2016, there were 11.06 Youth Criminal Justice Act violations per 100,000 population. In Halifax, that number was 5.16. Note that youth crime more broadly can include offenses beyond the Youth Criminal Justice Act.
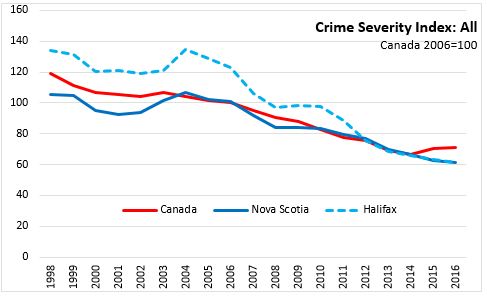
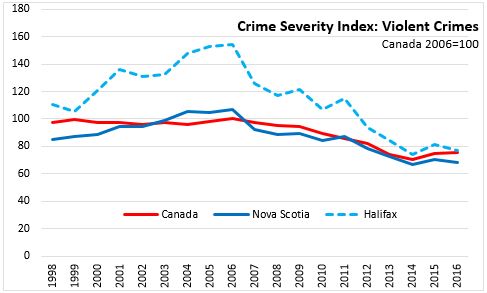
In addition to falling crime rates, the overall severity of crime, as measured by the Total Crime Severity Index (CSI) also declined for Nova Scotia (-2.5 per cent) and Halifax (-3.9 per cent). The severity of violent crime for Nova Scotia decreased (-3.1 per cent) while there was a larger decrease for Halifax (-5.4 per cent). Non-violent Crime Severity decreased both provincially (-2.3 per cent) and for Halifax (-3.2 per cent).

Source: Statistics Canada, CANSIM tables 252-0051 and 252-0052
<--- Return to Archive