The Economics and Statistics Division maintains archives of previous publications for accountability purposes, but makes no updates to keep these documents current with the latest data revisions from Statistics Canada. As a result, information in older documents may not be accurate. Please exercise caution when referring to older documents. For the latest information and historical data, please contact the individual listed to the right.
<--- Return to Archive
For additional information relating to this article, please contact:
July 19, 2017NOVA SCOTIA GOODS EXPORTS TO THE US-NEW ENGLAND REGION 2016 MARKETS – NEW ENGLAND REGION OF US EXPORT MARKET COMPARED WITH NS GLOBAL EXPORT TRADE
In 2016 Nova Scotia produced and exported $5.2 billion worth of goods to the international market. The United States was the destination of the largest proportion of Nova Scotia’s global exports (68.97% share, $3.6 billion). China was the number two destination at a 9.39% share ($491 million), Europe was the third largest geographic market at an 8.57% share ($448 million). And Asia (excluding the Middle East and China) was the number fourth destination (8.81% share, $460.5 million). The balance of Nova Scotia's export trade (4.26%) was distributed among Central/South America, the Caribbean, Africa, the Middle East and Oceania countries.
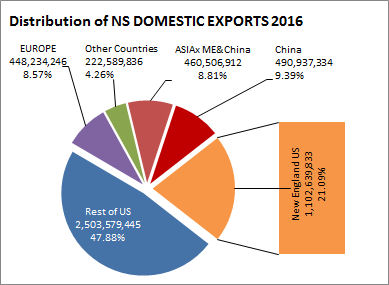
In 2016 Nova Scotia produced and exported $1.103 billion worth of goods to the New England Region of the United States. This market represents 30.58% of Nova Scotia’s US export trade and 21.09% of Nova Scotia’s global export trade.
US-NEW ENGLAND BY STATE
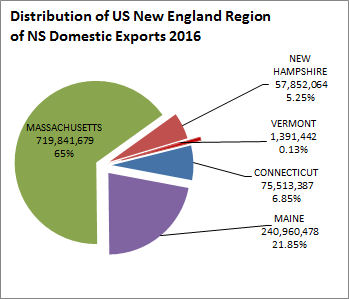
There are six states in the US New England region. Over 65% of Nova Scotia exports to this region go to one US state – Massachusetts. This state is the recipient of most of our Natural Gas (99%) and Seafood (70%) exports. Maine is the destination of 21.85% and the remaining four states share in 12.86%.
LONG RUN TRENDS
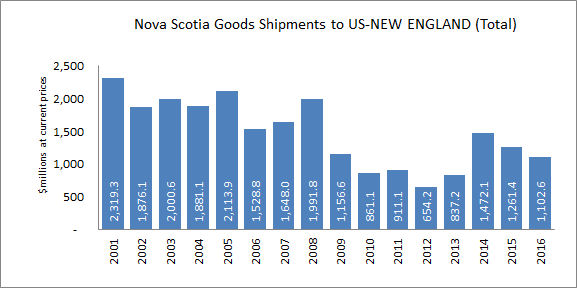
Trade with the New England US trended downwards over the last fifteen years. From a peak of $2.3 billion in 2001, export sales have declined steadily to a low of $654.2 million in 2012, with a recovery and decline in 2013 to 2016. The most serious decline occurred in 2009 during the global recession. Export trade declined $835.2 million, then continued to decline to 2012.
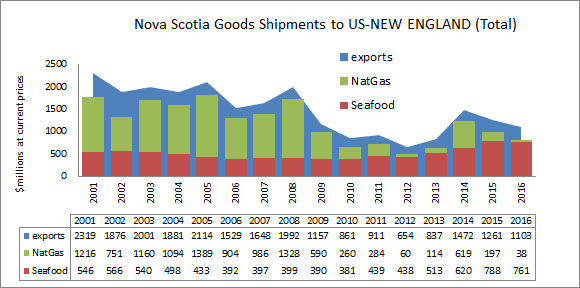
Trade with New England region has concentrated in two commodities – seafood and natural gas. Together they averaged 80% of Nova Scotia exports to the region.
While seafood has had a slow but steady increase over the period, natural gas exports were strong 2001 to 2008, then suffered from the global decline in oil prices in 2009-2013. The current recovery is now subject to declining gas field production.
PRODUCTS – LEADING NOVA SCOTIA EXPORTS TO NEW ENGLAND US
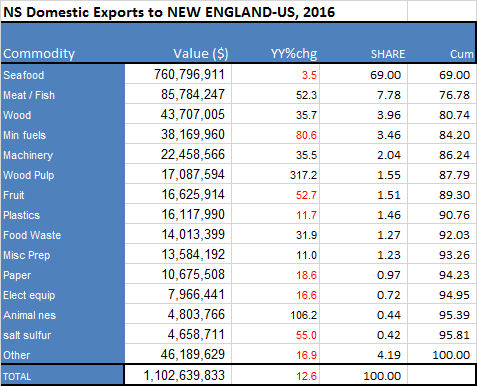
Nova Scotia companies produced and shipped $1.103 billion worth of goods to US-New England in 2016 as compared to the $1.261 million last year and $654.2 million in 2012. Since 2012, the value of exports has increased 68.5%, and has decreased 12.6% over 2015.
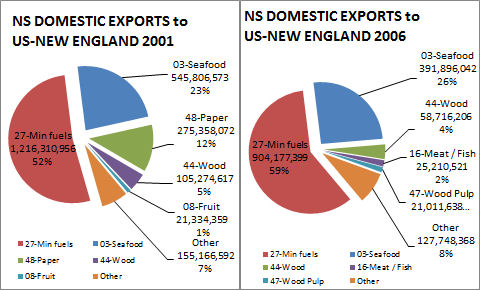
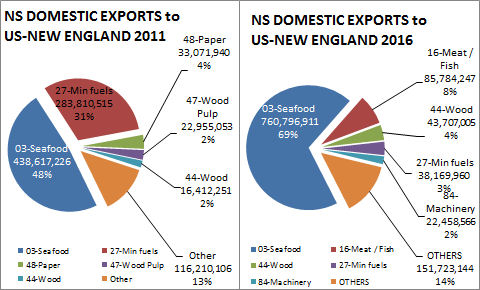
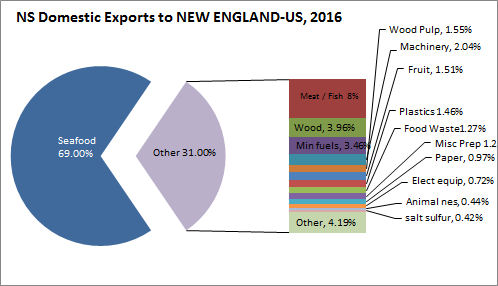
Fish, Crustaceans, Molluscs and Other Aquatic Invertebrates (Seafood) ranked either 1st or 2nd in export value over the 2001-2016 period. Over the period 2001-2016, export value ranged from a low of $381 million in 2010 to a high of $788 million in 2015. In 2016, exports of Fish declined 3.5% over 2015 to $760.8 million. Share of total exports to New England was 69%.
Meat and Fish Prep have ranked between 8th and 2nd over the 2001-2016 period, with value ranging from $8 million in 2010 to $86 million in 2016. In 2016, export value increased 52.3% over 2015.
Natural Gas ranked number one between 2001 and 2009, then the global recession drove oil and gas prices down. Natural Gas dropped to the 2nd rank up to 2015 when gas field production and domestic consumption lowered export volumes. Over the period, export value ranged from a high of $1.4 billion in 2005, to a low of $38.2 million in 2016. In 2016, natural gas international exports declined 81%.
Wood products ranked between 3rd and 6th over the 2001-2016 period. Export values ranged from a low of $13.5 million in 2009, and a high of $105 million in 2001. In 2016, Wood product exports increased 36% to $43.7 million over 2015.
Paper and Paperboard ranked either 3rd or 4th in 11 years over the 2001-2016. In other years rank bottomed out at 15th. Export values range from a low of $3.8 million in 2012 to a high of $275 million in 2001. In 2016, Paper and paperboard product exports declined 18.6% to $11 million.
Wood Pulp ranked between 3rd and 7th in 15 of the last 17 years. Export values ranged from a low of $4.1 million in 2015 to a high of $43.7 million in 2008. In 2016, Wood Pulp exports increased over 300% to $17.1 million.
Fruit exports ranged from a low of $6.8 million in 2009, to a high of $35.1 million in 2015. In 2016, Fruits decreased 53% over 2015.
Distribution of the top five export goods to New England-US, Selected Years.
TOP 15 Goods Exported to New England Region US
Industry Canada's Strategis and STC Trade Database
<--- Return to Archive