The Economics and Statistics Division maintains archives of previous publications for accountability purposes, but makes no updates to keep these documents current with the latest data revisions from Statistics Canada. As a result, information in older documents may not be accurate. Please exercise caution when referring to older documents. For the latest information and historical data, please contact the individual listed to the right.
<--- Return to Archive
For additional information relating to this article, please contact:
July 06, 2017NOVA SCOTIA - INTERNATIONAL MERCHANDISE TRADE MAY 2017 CUSTOMS BASIS
Unadjusted
YTD - All merchandise
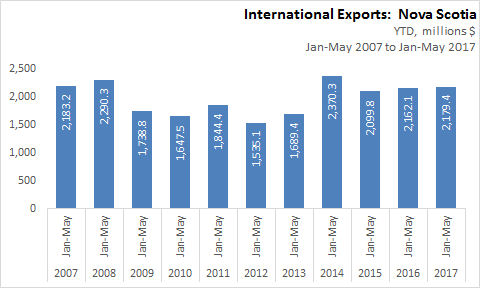
In Jan-May 2017, Nova Scotia merchandise trade exports increased $17.3 million to $2.179 billion over Jan-May 2016. This is a recent high, but not quite the all time high of $2.37 billion in Jan-May 2014, or the high point in Jan-May 2008 ($2.29 billion) before the slump 2009 to 2013.
YTD - By Sector
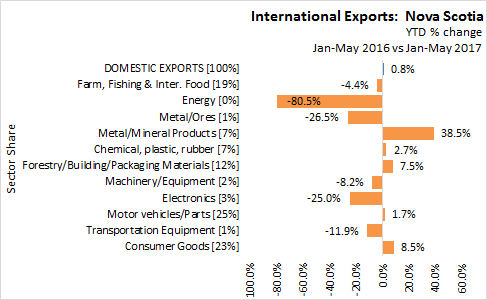
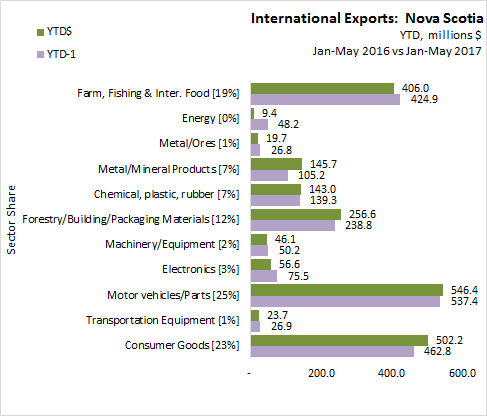
In Nova Scotia for January-May 2017, merchandise exports ($2.179 billion) increased over $17 million over the Jan-May 2016 exports ($2.162 billion). Increases in Metal/Mineral products, and Consumer goods were sufficient to offset declines in Energy, Electronics, and Farming/fishing.
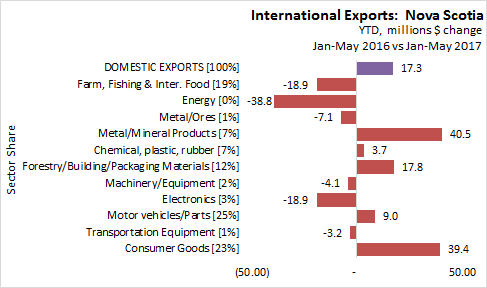
Year-to-date (YTD ) results for:
- Energy products have decreased ($38.8 million) from $48.2 million to $9.4 million;
- Farm, fishing and intermediate food products decreased ($18.9 million) from $424.9 million to $406.0 million
- Electronics decreased ($18.9 million) from $75.5 million to $56.6 million;
- Metal/Ores products decreased ($7.1million) from $26.8 million to $19.7 million;
- Machinery/Equipment decreased ($4.1 million) from $50.2 million to $46.1 million;
- Transportation Equipment decreased ($3.2 million) from $26.9 million to $23.7 million;
- Metal/Mineral products increased ($40.5 million) from $105.2 million to $145.7 million;
- Consumer products have increased ($39.4 million) from $462.8 million to $502.2 million;
- Forestry products increased ($17.8 million) from $238.8 million to $256.6 million;
- Motorvehicles/Parts increased ($9.0 million) from $537.4 million to $546.4 million;
- Chemicals, plastics and rubber products have increased ($3.7 million) from $139.3 million to $143.0 million.
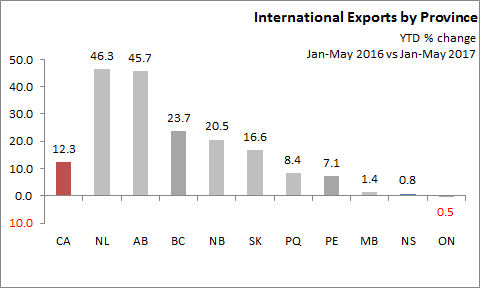
YTD by Province
In Jan-May 2017, Newfoundland ranked first among the provinces in growth of domestic exports. Year-to-date exports increased 46.3 per cent over the same period last year. Canadian year to date exports are up 12.3 per cent.
In Jan-May 2017, Nova Scotia ranked ninth from among the provinces in growth of domestic exports. Year-to-date exports increased 0.8 per cent over the same period last year.
SOURCES
<--- Return to Archive