The Economics and Statistics Division maintains archives of previous publications for accountability purposes, but makes no updates to keep these documents current with the latest data revisions from Statistics Canada. As a result, information in older documents may not be accurate. Please exercise caution when referring to older documents. For the latest information and historical data, please contact the individual listed to the right.
<--- Return to Archive
For additional information relating to this article, please contact:
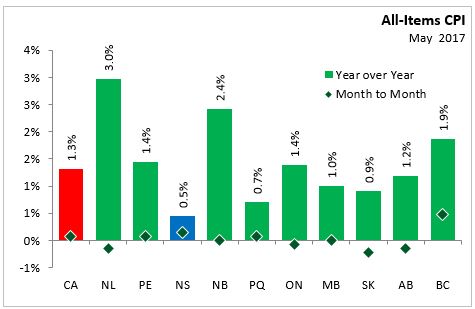
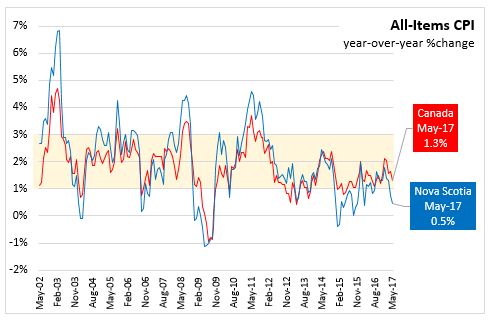
June 23, 2017ANALYSIS OF NOVA SCOTIA'S CONSUMER PRICE INDEX FOR MAY 2017 In Nova Scotia May 2017, annual consumer price inflation (year-over-year growth) was 0.5 per cent, below the national average of 1.3 per cent. Monthly consumer prices increased 0.2 per cent in Nova Scotia, while nationally prices increased 0.1 per cent.
Within Atlantic Canada, Newfoundland and Labrador (+3.0 per cent), New Brunswick (+2.4 per cent) had the highest annual inflation compared with Prince Edward Island (+1.4 per cent) and Nova Scotia (+0.5 per cent). On July 1, 2016, the provincial component of the harmonized sales tax (HST) increased in both Newfoundland and Labrador and New Brunswick. In Prince Edward Island, the provincial component of the HST was increased effective October 1, 2016.
All other provinces experienced positive annual inflation in May.
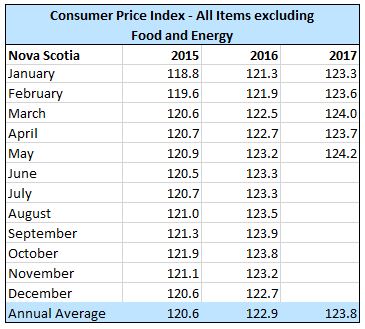
Nova Scotia's annual consumer price inflation (year over year growth in CPI) excluding food and energy rose 0.8 per cent in May, below the national rate of 1.4 per cent. Price level gains for this index were largest in New Brunswick (+2.8 per cent) and Newfoundland and Labrador (+2.7 per cent), and lowest in Quebec (+0.5 per cent). On a monthly basis, Nova Scotia's index excluding food and energy increased 0.4 per cent.
The main contributors to the monthly (May 2017 vs. April 2017) NS CPI movement:
Traveller Accommodation (+8.9%)
Fresh Fruit (+7.7%)
Gasoline (-4.0%)
Fresh or Frozen Beef (-3.2%)
The main contributors to the annual (April 2017 vs. April 2016) NS CPI movement:
Fuel oil and other fuels (+9.5%)
Tuition Fees (+5.2%)
Fresh or Frozen Beef (-19.1%)
Non-alcoholic beverages (-12.0%)
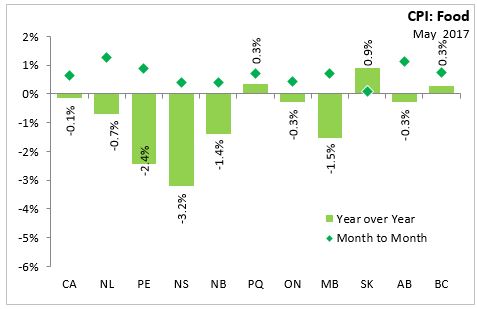
The CPI for food in Nova Scotia declined 3.2 per cent year-over-year with a 0.4 per cent increase month-over-month. CPI growth in food (year over year) declined in all provinces except in Quebec, Saskatchewan, and BC. Nationally, annual food prices declined 0.1 per cent.
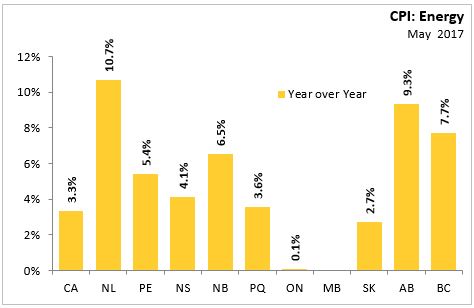
The Nova Scotia energy index increased by 4.1 per cent compared to a year ago. Energy prices were higher in all provinces except Manitoba (-0.1%) compared to a year ago. Energy prices saw the largest increase in Newfoundland and Labrador (+10.7 per cent).
FOCUS ON FUEL OIL AND INFLATION IN ATLANTIC CANADA
Atlantic Canadians spend a notably larger proportion of their total expenditure on gasoline and fuel oil compared to the rest of Canada, and because of this, changes in gasoline and fuel oil prices (especially during volatile oil market changes) can have a significant impact on the All-Items index in the region.
This month's
Analysis in Brief from Statistics Canada notes that when oil fell from US$100 per barrel to US$50 per barrel in late 2014, Atlantic Canada's average inflation slowed to -0.1 per cent (1Q2015), compared to a low of 1.0 per cent (2Q2015) in the rest of Canada.
Differences in CPI movement can also be attributed to basket weight, overall consumer spending, and overall volumes of fuel oil and gasoline within average consumer expenditure.
The combined basket weight of gasoline and fuel oil in the Atlantic Provinces has been consistently larger than those for the rest of the country since at least 1982. In 2013, fuel oil accounted for 1.8% of the overall CPI basket in the Atlantic Provinces— over eight times more than for the non-Atlantic provinces (0.22%). Gasoline also had a consistently larger basket weight in Atlantic Canada (6.1%) compared with the non-Atlantic provinces (4.7%).
Further, Atlantic Canadians spend less on goods and services than non Atlantic Canadians, and a higher proportion on gasoline and fuel oil. Atlantic Canada sees higher volumes of fuel oil consumption compared to the rest of Canada, and though Atlantic Canadian fuel oil prices may be lower, the volume consumed makes up for the share of expenditure in overall total consumption. Gasoline purchases in Atlantic Canada also make up a larger share of total consumer expenditure compared to the rest of the Country. Since 2007, expenditure on gasoline per vehicle has been, on vaverage, 7.4 per cent higher in Atlantic Canada compared to provinces outside Atlantic Canada (this is noted as a product of both price and quantity). Gasoline prices in Atlantic Canada were on average 1.2 per cent higher than non-Atlantic provinces from 2007 to 2015, but more importantly, quantities consumed were higher in Atlantic Canada, possibly owing to the highly rural nature of the Atlantic provinces.
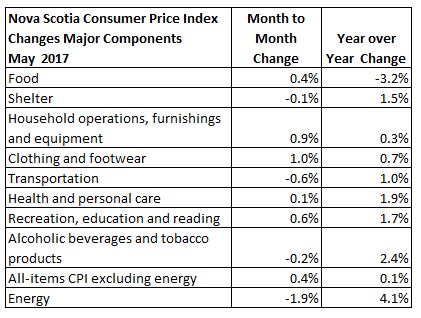
Major Components for May 2017
The following table shows the price increases specific to Nova Scotia for the major components of the CPI this month:
Long Run Trends
The All-Items CPI annual inflation rate for Nova Scotia was below Canada's in May 2017. Since June 2014, Nova Scotia's annual inflation has been below the Canadian average except for three months in 2016: January, September and November. While month to month movements in the indices can be different, over time they generally follow the same overall trend.
Annual inflation for the CPI excluding food and energy was lower for Nova Scotia (+0.8 per cent) than for Canada (+1.4 per cent).

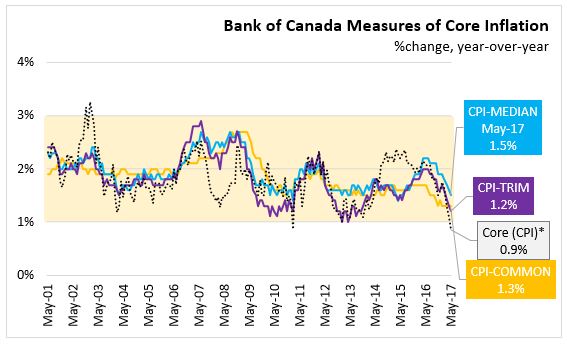
Bank of Canada's preferred measures of core inflation
Compared with May 2016, CPI-Common rose 1.3 per, CPI-Median rose 1.5 per cent, and CPI-Trim rose 1.2 per cent in Canada. All-items CPI excluding eight of the most volatile components as defined by the Bank of Canada and excluding the effect of changes in indirect taxes (formerly referred to as CPIX) rose 1.2 per cent year over year in May 2017.
Appendix Tables
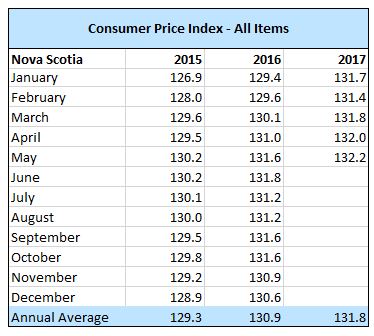
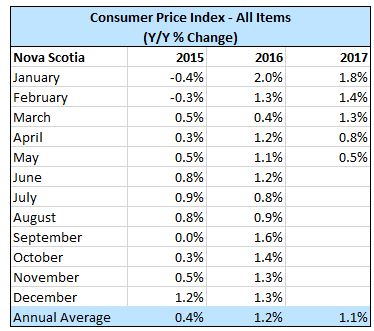

Source: Statistics Canada CANSIM Tables 326-0020 , 326-0023
<--- Return to Archive