The Economics and Statistics Division maintains archives of previous publications for accountability purposes, but makes no updates to keep these documents current with the latest data revisions from Statistics Canada. As a result, information in older documents may not be accurate. Please exercise caution when referring to older documents. For the latest information and historical data, please contact the individual listed to the right.
<--- Return to Archive
For additional information relating to this article, please contact:
June 14, 2017US RETAIL SALES, MAY 2017 Month-over-Month, Year-over-Year
The US Census Bureau announced today that the advance estimates of U.S retail and food service sales for May 2017 was a seasonally adjusted $473.8 billion, 0.3 per cent lower than April 2017 and 3.8 per cent higher than May 2016.
Retail trade sales decreased 0.3 per cent from April 2017 and increased 4.0 per cent year over last year. Building Material and Garden Equipment and Supply Dealers were up 10.8 percent from May 2016, while Nonstore Retailers were up 10.2 percent from last year.
Year-to-Date

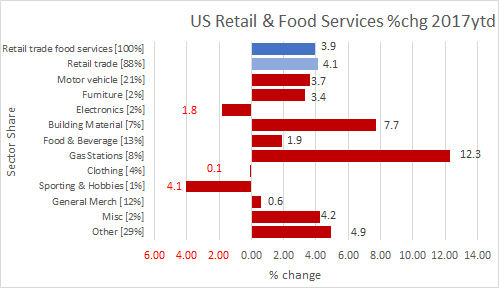
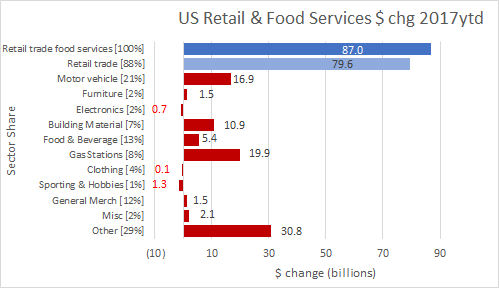
In Jan-May 2017, the United States unadjusted retail sales and food services increased 3.9% ($87.0 billion) over Jan-May 2016 to $2.3 trillion.
- Other Retail Operations (including food services), 29% of total retail trade increased 4.9% or $30.8 billion.
- Gasoline Stations, 8% of total retail trade increased 12.3% or $19.9 billion.
- Motor vehicle sector, 21% of total retail trade increased 3.7% or $16.9 billion.
- Building materials, 7% of total retail trade increased 7.7% or $10.9 billion.
- Food and beverage sector, 13% of total retail trade increased 1.9% or $5.4 billion.
- Misc. retail, 2% of total retail trade increased 4.2% or $2.1 billion.
- Furniture stores, 2% of total retail trade increased 3.4% or $1.5 billion.
- General merchandise stores, 12% of total retail trade increased 0.6% or $1.5 billion.
- Sports and hobby stores, 1% of total retail trade decreased 4.1% or $1.3 billion.
- Electronics stores, 2% of total retail trade decreased 1.8% or $0.7 billion.
- Clothing Stores, 4% of total retail trade decreased 0.1% or $0.1 billion.
Source: US Census Bureau, Data Tables
<--- Return to Archive