The Economics and Statistics Division maintains archives of previous publications for accountability purposes, but makes no updates to keep these documents current with the latest data revisions from Statistics Canada. As a result, information in older documents may not be accurate. Please exercise caution when referring to older documents. For the latest information and historical data, please contact the individual listed to the right.
<--- Return to Archive
For additional information relating to this article, please contact:
June 12, 2017NOVA SCOTIA GOODS EXPORTS TO THE EUROPEAN UNION 2016 MARKETS - EUROPEAN AND EURO AREA MARKETS COMPARED WITH NS GLOBAL EXPORTS
In 2016 Nova Scotia produced and exported $5.2 billion worth of goods to the international market. The United States was the destination of the largest proportion of Nova Scotia’s global exports (68.87% share, $3.6 billion). China was the number two destination at a 9.39% share ($491 million), Europe was the third largest geographic market at an 8.57% share ($448 million). And Asia (excluding the Middle East and China) was the number fourth destination (8.81% share, $460.5 million). The balance of Nova Scotia's export trade (4.26%) was distributed among Central/South America, the Caribbean, Africa, the Middle East and Oceania countries.
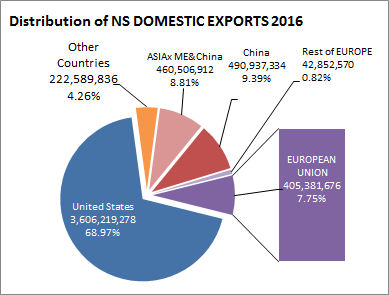
In 2016 Nova Scotia produced and exported $405 million worth of goods to the European Union. This market represents 7.75% of Nova Scotia’s global export trade.
Trade with the European Union has generally been up and down over the last fifteen years -- from a low of $334 million in 2002, to a peak of $521 million in 2006.
During the global recession of 2009 ($398 million), exports declined 17.8% over 2008. By 2010, export values had quickly recovered to about pre-2005 values ($458 million), but declined again to below 2009 levels by 2012 ($366 million). The current export sales have leveled off to about 2009 levels, with an exceptional year in 2015 ($489 million).

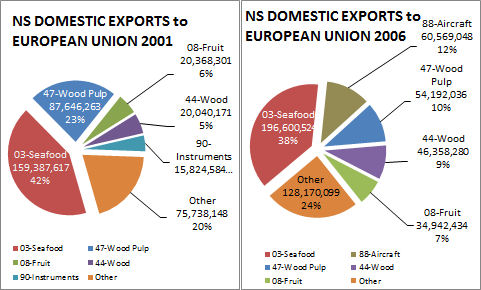
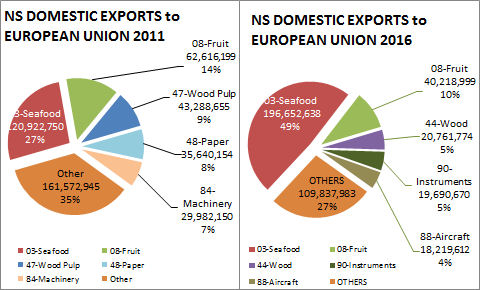
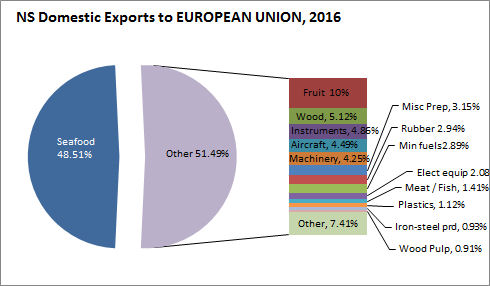
Trade with the European Union has concentrated among 10 commodities. The number one export to the Uropen Union is Seafood accounting for 49% of Nova Scotia trade with the European Union. . The top four of these commodities share between 50% and 75% of total exports. Seafood, fruit, wood pulp and articles of wood are a characteristic export bundle.

MARKETS – EURO AREA EXPORT MARKET COMPARED WITH NS GLOBAL EXPORT
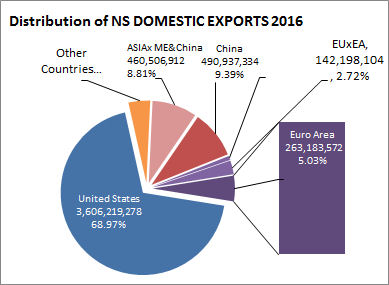
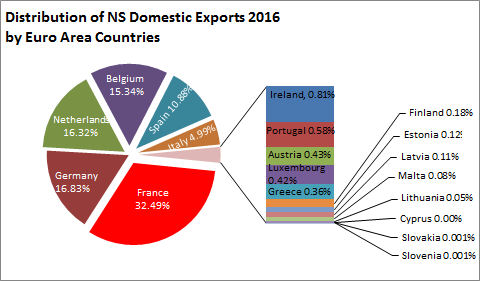
The European Union is a market comprised of 28 different counties, but, the EU also includes the Euro Area – a customs union comprise of 19 countries from within the European Union that share the same currency, the Euro. In 2016 Nova Scotia produced and exported $263 million worth of goods to the Euro Area of the European Union. This market represents 5.03% of Nova Scotia’s global export trade.
PRODUCTS – LEADING NOVA SCOTIA EXPORTS TO EUROPEAN UNION
Nova Scotia companies produced and shipped $405 million worth of goods to the European Union 2016 as compared to the $521 million in 2006 and $334 million in 2002. Since 2012, the value of exports has increased 10.7%, and have declined 17.1% over 2015.
Seafood - Fish, Crustaceans, Molluscs has been the number one export to the European Union between 2001 and 2016. Export values over the period ranged from $118 million in 2010 to a high of $235 million in 2015. In 2016, export value declined 16.3% to $197 million over 2015.
Edible Fruits and Nuts ranked between 2nd to 4th over the 2001-2016 period. Export values ranged from a low of $18 million in 2002, to a high of $63 million in 2011. In 2016, Fruit declined 6.9% to $40 million over 2015.
Wood and Articles of Wood ranked between 2nd and 6th place over the period. Export value ranged from a low of $16 million in 2012 to a high of $60 million in 2010. In 2016, Wood products decreased 12.4% to $21 million over 2015.
Pulp of Wood and The Like also ranked 2nd or 6rd from 2001 to 2012, but then fell off to as low as 16th spot in later years. Export value ranged from $2.5 million in 2014 to a high of $99 million in 2004. In 2016, Wood Pulp declined 30.2% to $3.7 million over 2015.
Machinery consistently ranked 4th to 6th over the 2001-2016 period. Export value ranged from $12 million in 2002 to a high of $34 million in 2010. In 2016, Machinery declined 25.5% to $17 million over 2015.
Paper, Paperboard products made the top five in four years, and top ten in seven other years. Over the period 2001-2016 export values ranged from $0.3 million in 2015 to $42 million in 2009.
Instruments ranked in the top 10 for most of the period. Export values ranged from $5 million in 2004 to $20 million in 2015. In 2016, Instruments decreased 0.3% over 2015.
Mineral Fuels ranked in the top 10 from 2010 to 2016. During this period export sales ranged from a low of $11 million in 2012 to a high of $67 million in 2013.
Distribution of the top five export goods to European Union, Selected Years.
TOP 15 Goods Exported to European Union

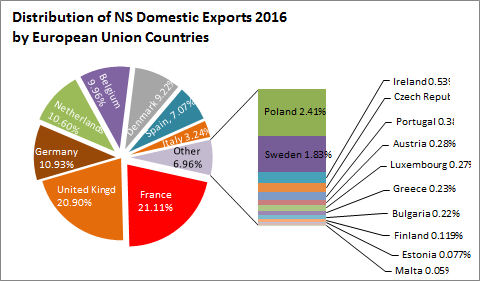
DISTRIBUTION OF NOVA SCOTIA MERCHANDISE TRADE EXPORTS TO MEMBERS OF THE EUROPEAN UNION AND THE EURO AREA
2016,
- France received 1.63% of Nova Scotia global goods exports, 21.11% of Nova Scotia’s European Union exports, and 32.49% of Nova Scotia’s Euro Area exports. In all French trade was valued at $85.5 million.
- The United Kingdom received 1.62% of Nova Scotia global goods exports, 20.9% of Nova Scotia’s European Union exports. The United Kingdom is not a member of the Euro Area. In all, the United Kingdom received trade valued at $84.6 million.
- Germany received 0.85% of Nova Scotia global goods exports, 10.92% of Nova Scotia’s European Union exports, and 16.83% of Nova Scotia’s Euro Area exports. In all, the German trade was valued at $44.3 million.

Source: Industry Canada's Strategis | Bureau of Economic Analysis
<--- Return to Archive