The Economics and Statistics Division maintains archives of previous publications for accountability purposes, but makes no updates to keep these documents current with the latest data revisions from Statistics Canada. As a result, information in older documents may not be accurate. Please exercise caution when referring to older documents. For the latest information and historical data, please contact the individual listed to the right.
<--- Return to Archive
For additional information relating to this article, please contact:
June 02, 2017US EMPLOYMENT, MAY 2017 US non-farm employment rose +138,000 in May 2017, down from the 174,000 reported last month. Over the previous 12 months, employment increased by an average of +189,000 per month.
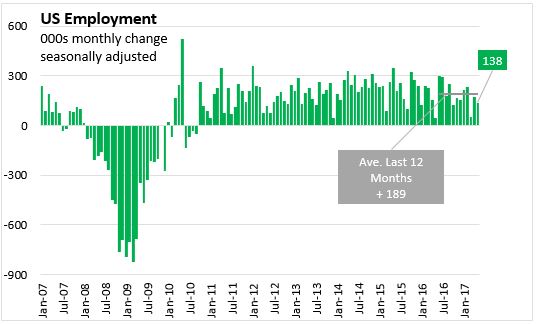
Employment in healthcare rose by 24,000, while professional and business services increased by 38,000. Food services and drinking places continued to trend upwards, with gains of 30,000 this month.
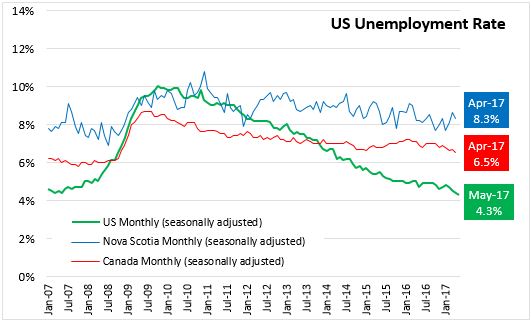
Comparing the US with Canada and Nova Scotia, the NS unemployment rate for April was 8.3 per cent while Canada's was 6.5 per cent. Although monthly unemployment rates are more variable in Nova Scotia (smaller sample size) the long run average of NS unemployment rates is typically higher than the US, except during the 2009 recession.
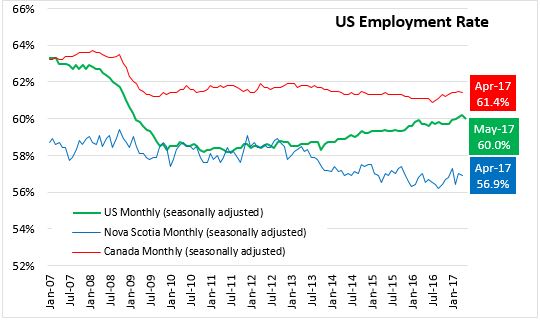
The US employment rate dipped in May 60.0 per cent, bucking its long, slow upward trend since 2014. This is higher than the NS April employment rate of 56.9 per cent, which has experienced some months of volatility. In comparison, the national employment rate in Canada has been on a rising trend since the middle of 2016.
The US participation rate decreased 0.2 percentage points in May to 62.7 per cent, bringing the civilian labour force down by 429,000. The NS participation rate in the labour force has been volatile in recent months, falling slightly to 62.0 per cent in April. Canada's labour force participation rates have been stable at just under 66 per cent since 2015.
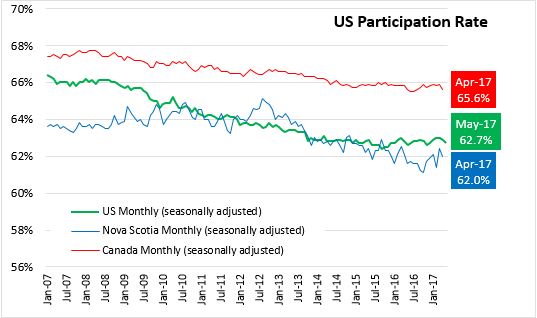
Note: NS and US labour force statistics refer to different working-age cohorts.
Source: US Bureau of Labor Statistics, Statistics Canada CANSIM table 282-0087
<--- Return to Archive