The Economics and Statistics Division maintains archives of previous publications for accountability purposes, but makes no updates to keep these documents current with the latest data revisions from Statistics Canada. As a result, information in older documents may not be accurate. Please exercise caution when referring to older documents. For the latest information and historical data, please contact the individual listed to the right.
<--- Return to Archive
For additional information relating to this article, please contact:
May 18, 2017EMPLOYMENT INSURANCE, MARCH 2017 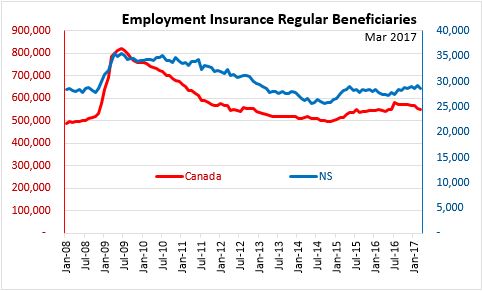
In March 2017, the number (seasonally adjusted) of Nova Scotians receiving regular Employment Insurance (EI) benefits decreased by 710 persons (2.4 per cent) from the previous month to 28,560 and increased by 1,070 persons (3.9 per cent) over March 2016.
In March 2017, the number (seasonally adjusted) of Canadians receiving regular EI benefits decreased 0.5 per cent (-2,850 persons) from the previous month to 551,070. The number of regular EI beneficiaries increased by 3,750 (0.7 per cent) over March 2016, partially reflecting legislative changes to the EI program that came into effect in July 2016.
The number (seasonally adjusted) of Nova Scotians receiving regular EI benefits in March 2017 accounted for 5.9 per cent of the total labour force. In Canada, the number of EI beneficiaries accounted for 2.8 per cent of the total labour force.
The number of EI beneficiaries in Nova Scotia has been on a slow but steady upward trend since mid-2016, following stability in 2015 and a slight decline in early-2016. Growth in EI beneficiaries since May of 2016 has been disproportionately concentrated among 15 to 24 year olds, recipients last employed in sales and service occupations (which accounted for almost half of the increase), and has been wide spread across the province.
AGE
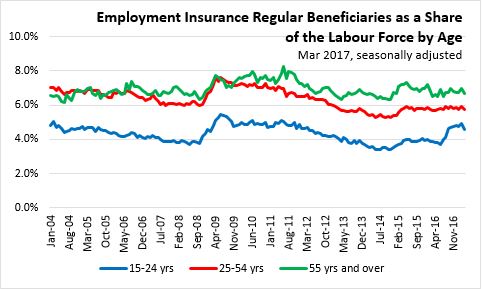
The majority (61.7 per cent) of regular EI recipients in Nova Scotia were in the 25 to 54 age group, who make up 62.4 per cent of the labour force. Although they account for 23.4 per cent of the labour force, 27.1 per cent of EI recipients were in the 55 years and over age group. A further 11.3 per cent of EI recipients were in the 15 to 24 age group, though they are 14.2 per cent of the labour force and 27.0 per cent of the unemployed.
For people aged 55 years and over, EI beneficiaries accounted for 6.7 per cent of the labour force in the same age range. For the labour force between the ages of 25 and 54, EI beneficiaries accounted for 5.7 per cent of the total and for ages 15 to 24, they accounted for 4.6 per cent.
On a year-over-year basis, the number of beneficiaries in the 15 to 24 age group increased by 430 persons, the 25-54 age group increased by 190 persons, and the 55 years and over group increased by 450 persons.
COUNTIES
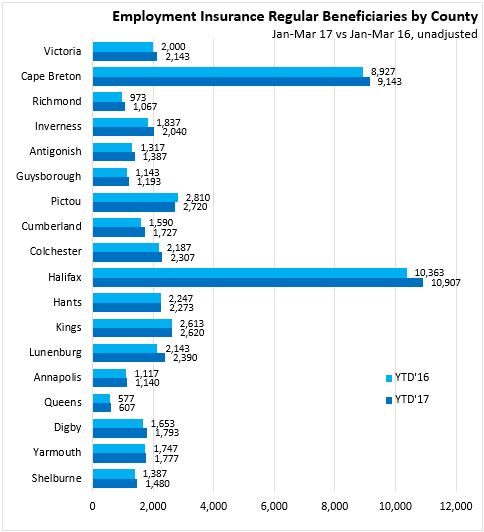
In March 2017, fourteen counties reported higher regular EI beneficiaries compared to a year ago, including the most populace counties of Halifax and Cape Breton, while three counties showed a decrease and one was unchanged.
OCCUPATION
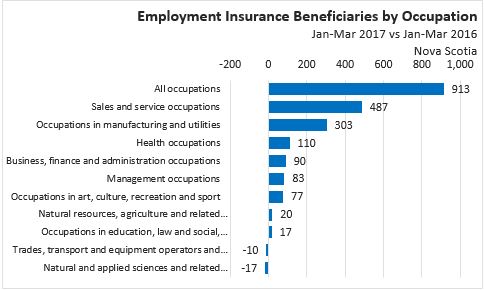
In Nova Scotia in March 2017, the highest number of EI recipients were last employed in the trades, transport and equipment operators occupations (9,120, or 31.9 per cent of the monthly total), followed by sales and service occupations (5,250 or 18.4 per cent of the total) and natural resources, agriculture and related occupations (3,740, or 13.1 per cent of the total).
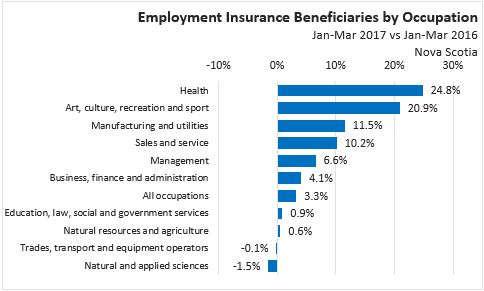
Comparing the first three months of 2017 to the same period in 2016, the largest percentage increase in EI beneficiaries was among recipients last employed in health occupations, while the largest increase in absolute terms was among recipients last employed in sales and services occupations. In both percentage and absolute terms, the number of EI beneficiaries declined the most over this period for recipients that were last employed in natural and applied sciences.
YEAR TO DATE - PROVINCES
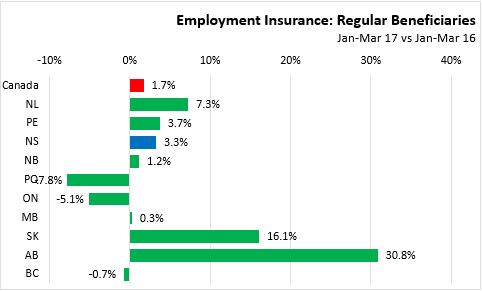
Across the country, seven provinces saw year to date increases in EI beneficiaries. Alberta (+30.8 per cent) led provinces in year to date EI beneficiary growth, followed by Saskatchewan (+16.1 per cent) and Newfoundland and Labrador (+7.3 per cent). Quebec (-7.8 per cent), Ontario (-5.1 per cent), and British Columbia (-0.7 per cent) posted declines in the number of EI beneficiaries. The average across Canada was a 1.7% increase in annual average EI beneficiaries.
EI BENEFICIARIES AS A SHARE OF THE UNEMPLOYED BY PROVINCE
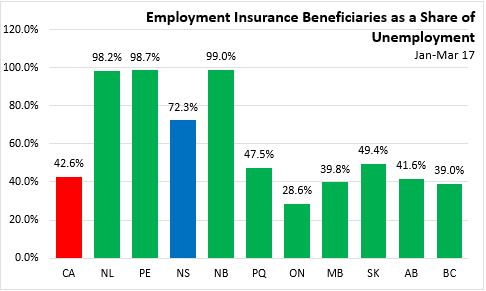
In Nova Scotia, EI beneficiaries accounted for 72.3 per cent of the unemployed in March 2017, compared to a Canadian rate of 42.6 per cent. Across the country, EI beneficiaries accounted for the highest shares of the unemployed in the Atlantic provinces, led by New Brunswick, Newfoundland and Labrador, and Prince Edward Island. EI beneficiaries accounted for the lowest shares in Ontario, followed by British Columbia, Manitoba, and Alberta.
Note that due to differences in estimation methodology, it is possible for the reported number of EI beneficiaries to exceed the reported number of unemployed in a given jurisdiction.
Note: Legislative changes to the EI program came into effect in July 2016. While some of these changes affected all EI regions across Canada, eligible claimants in the 15 regions that posted notable increases in unemployment received additional weeks of regular benefits starting in July. More information on the 2016 EI changes is available on Employment and Social Development Canada's (ESDC) website. As a result of the changes to the EI program, historical comparisons are not recommended, except in areas outside of the 15 EI regions where eligible claimants received additional weeks of benefits. These 15 EI regions are Newfoundland and Labrador, Northern Ontario, Sudbury, Northern Manitoba, Southern Saskatchewan, Northern Saskatchewan, Saskatoon, Southern Alberta, Northern Alberta, Calgary, Edmonton, Southern Interior British Columbia, Northern British Columbia, Whitehorse and Nunavut.
Statistics Canada CANSIM 276-0022 (Age, Province), 276-0043 (Occupation), 276-0035 (County level)
<--- Return to Archive