The Economics and Statistics Division maintains archives of previous publications for accountability purposes, but makes no updates to keep these documents current with the latest data revisions from Statistics Canada. As a result, information in older documents may not be accurate. Please exercise caution when referring to older documents. For the latest information and historical data, please contact the individual listed to the right.
<--- Return to Archive
For additional information relating to this article, please contact:
May 11, 2017NEW HOUSING PRICE INDEX, MARCH 2017 The price of new housing in Nova Scotia was unchanged in March from January and February (index of 100.2), compared with an increase in new housing in Canada of 0.2 per cent month to month. In Canada, new housing prices have been on a general upward trend since 2009.
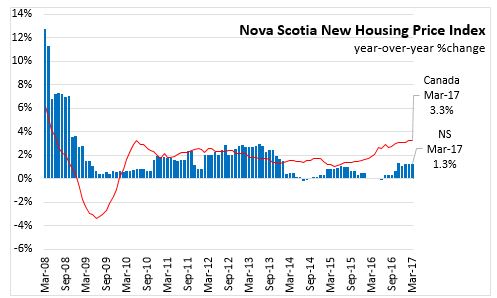
Nova Scotia new housing prices are 1.3 per cent above the level in March 2016. National housing prices are 3.3 per cent above their levels a year ago.
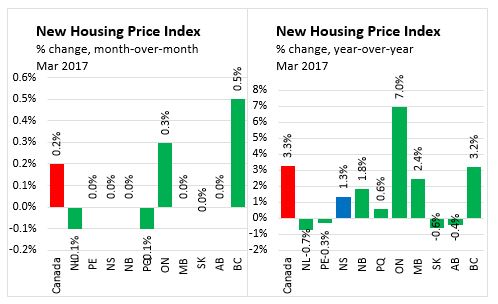
Across Canada, Ontario (+7.0 per cent) and British Columbia (+3.2 per cent) saw the fastest increases in new housing prices from March 2016 to March 2017. Saskatchewan, Alberta, Newfoundland and Labrador and Prince Edward Island saw declines in new housing prices.
In recent months, year-over-year growth in the Nova Scotia new housing price index has picked up following slower growth in the second half of 2015 and the first half of 2016.
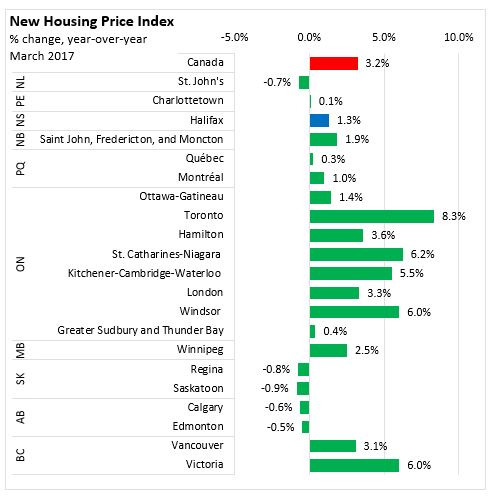
Census Metropolitan Areas
Among Census Metropolitan Areas tracked by the new housing price index, March 2017 prices are growing faster around the Greater Toronto Area as well as in St. Catharines-Niagara, Windsor, and Victoria (year over year). New housing prices have declined in St. John's, Charlottetown, Regina, Saskatoon, Calgary and Edmonton.
Statistics Canada Note: With the release of the January 2017 NHPI data, a number of important changes have been introduced to increase the relevance of the index series. The index base period, for which the NHPI equals 100, is now December 2016. The NHPI basket has been updated with new weights for the 2017 series, its coverage has been expanded to include new CMAs and new indexes have been published for the Toronto, Ottawa and Greater Sudbury areas. Data for periods prior to January 2017 have been obtained by linking the new NHPI series, where possible, with indexes in CANSIM table 327-0046.
Source Statistics Canada, CANSIM table 327-0056
<--- Return to Archive