The Economics and Statistics Division maintains archives of previous publications for accountability purposes, but makes no updates to keep these documents current with the latest data revisions from Statistics Canada. As a result, information in older documents may not be accurate. Please exercise caution when referring to older documents. For the latest information and historical data, please contact the individual listed to the right.
<--- Return to Archive
For additional information relating to this article, please contact:
April 04, 2017NOVA SCOTIA - INTERNATIONAL MERCHANDISE TRADE FEBRUARY 2017 CUSTOMS BASIS
Unadjusted
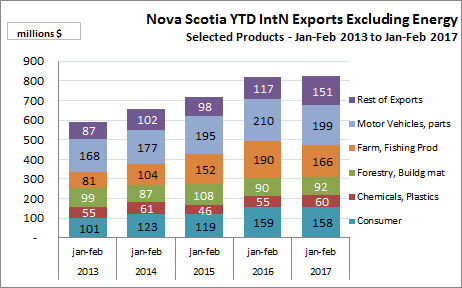
YTD - Selected Commodities
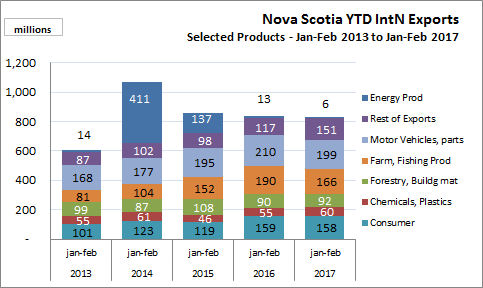
In Nova Scotia for January-February 2017, merchandise exports ($831.4 million) decreased $4.1 million over the Jan-Feb 2016 exports ($835.5 million). Increases in Forestry, Chemicals, and other exports were not sufficient to offset declines in Farming/fishing, Motor Vehicles, Consumer products and energy products.
Year-to-date (YTD ) results for:
- Farm, fishing and intermediate food products decreased from $190 million to $166 million
- Motor vehicles and parts decreased from $210 million to $199 million;
- Consumer products have decreased from $159 million to $158 million;
- Energy products have decreased from $13 million to $6 million;
- Forestry products have increased from $90 million to $92 million;
- Chemicals, plastics and rubber products have increased from $55 million to $60 million;
- the remaining commodities have increased from $117 million to $151 million.
YTD by Province
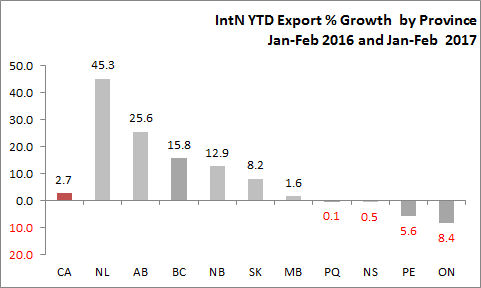
In Jan-Feb 2017, Nova Scotia ranked eightth from among the provinces in growth of domestic exports. Year-to-date exports decreased 0.5 per cent over the same period last year. Canadian ytd exports are up 2.7 per cent.
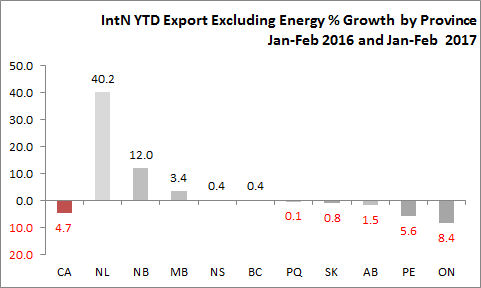
Nova Scotia's non-energy exports ranking 4th among the provinces and have increased 0.4 per cent over Jan-Feb 2016. Nationally, non-energy exports are down 4.7 per cent.
Statistics Canada NOTES
The old CANSIM tables 228-0001 to 228-0003, 228-0033, 228-0034, 228-0041 to 228-0043 and 228-0047 to 228-0057 were replaced by tables 228-0058 to 228-0068.
Publication: Canada's Balance of International Payments (Catalogue number 67-001-X)
These data are available in the Canadian international merchandise trade database.
<--- Return to Archive