The Economics and Statistics Division maintains archives of previous publications for accountability purposes, but makes no updates to keep these documents current with the latest data revisions from Statistics Canada. As a result, information in older documents may not be accurate. Please exercise caution when referring to older documents. For the latest information and historical data, please contact the individual listed to the right.
<--- Return to Archive
For additional information relating to this article, please contact:
March 31, 2017EMPLOYMENT, EARNINGS AND HOURS, JANUARY 2017 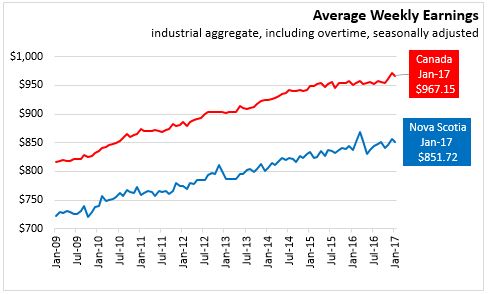
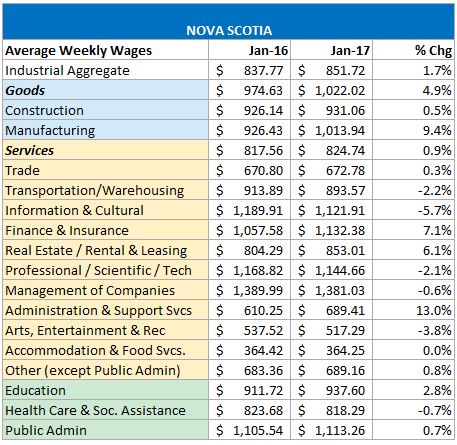
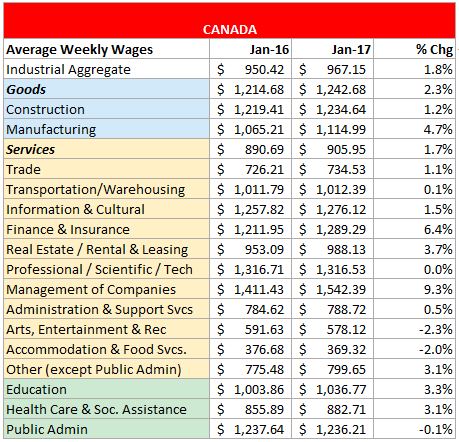
Nova Scotians' average weekly earnings (including overtime, seasonally adjusted) decreased $4.33 per week (0.5 per cent) from December to $851.72 in January 2017. The current level is 1.7 per cent higher than its level in January of last year. Canadians' average weekly wages decreased 0.4 per cent from December to $967.15 in January 2017, 1.8 per cent above the level in January of last year.
In general, changes in weekly earnings reflect a number of factors, including wage growth; changes in the composition of employment by industry, occupation and level of job experience; and average hours worked per week.
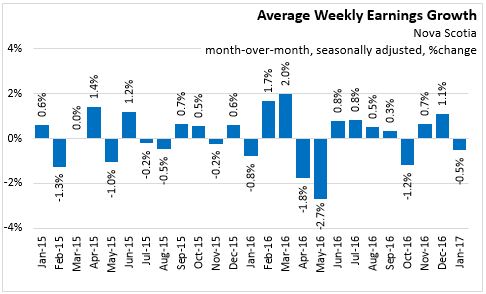
Nova Scotia average weekly wages increased in four of the last six months.
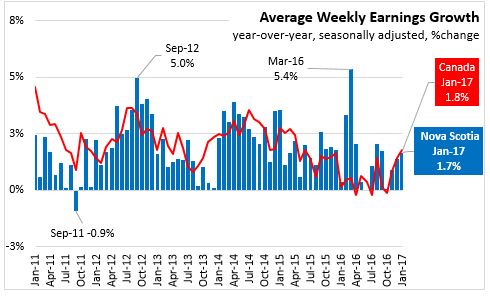
Comparing January 2017 to January 2016, average weekly wages are higher in all provinces exept Alberta.

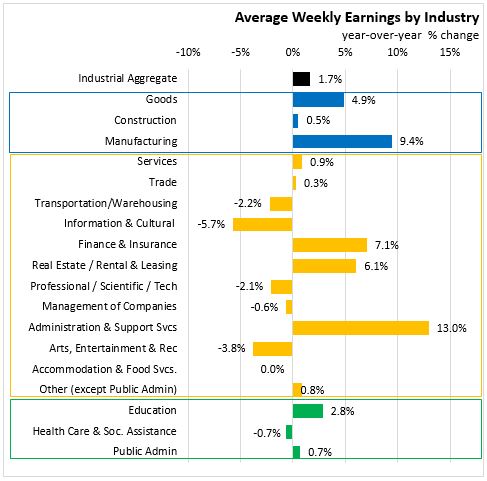
Comparing January 2017 to January 2016, average weekly earnings increased 4.9 per cent in Nova Scotia's goods sectors and 0.9 per cent in Nova Scotia's service sectors. Increases are largest in the administration and support services sector.
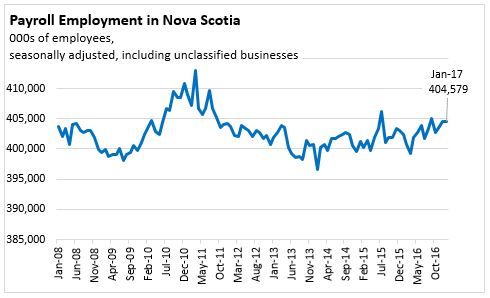
EMPLOYMENT
In January 2017, Nova Scotia had 404,579 payroll employees, unchanged from December, and 0.5 per cent above the level in January last year.
Canada had 16.0 million employees, unchanged from December, and 1.6 per cent above the level in January last year.
REFERENCE TABLES: YEAR-OVER-YEAR
Source: Statistics Canada, Survey of Employment, Payroll, and Hours. CANSIM Table 281-0063
<--- Return to Archive