The Economics and Statistics Division maintains archives of previous publications for accountability purposes, but makes no updates to keep these documents current with the latest data revisions from Statistics Canada. As a result, information in older documents may not be accurate. Please exercise caution when referring to older documents. For the latest information and historical data, please contact the individual listed to the right.
<--- Return to Archive
For additional information relating to this article, please contact:
March 27, 2017NOVA SCOTIA – ONTARIO: INTER-PROVINCIAL TRADE 2013 The trade flow data from the National Accounts Input-Output tables represent provincial total and net expenditures for interprovincial (intP) markets. Data is provided for exports and imports, goods and services and for over a thousand commodity levels (IOCC). The following is an analysis of intP trade between Nova Scotia and Ontario, highlighting the top 25 commodities in goods and in services.
Input-Output Commodity Codes (IOCC)
Exports and Imports
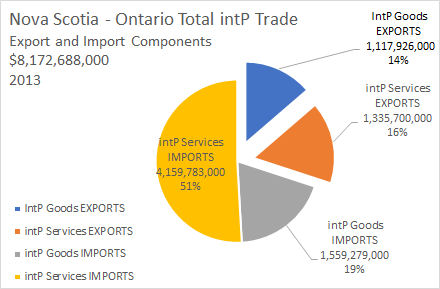
In 2013, Nova Scotia the value of total trade (import plus exports) with Ontario was almost $8.2 billion. More than half (51%) of this trade was in service imports and another 19% in goods imports.
In other words, 70% of Nova Scotia's total trade with Ontario was imports of goods and services. The remaining 30% of total trade was Nova Scotia exports to Ontario. They were almost evenly split between goods (14% to total trade) and services (16% of total trade).
Goods and Services
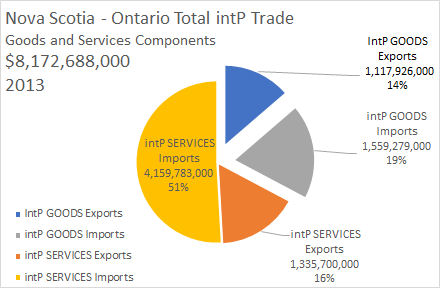
Rearranging the total trade components into goods and services reveals that 67% of Nova Scotia - Ontario trade is trade in services, and 23% is trade in goods.
In 2013 the value of NS-ON services trade was $5.5 billion. Nova Scotia exported $1.3 billion worth of services to Ontario and imported $4.2 billion worth of services from Ontario.
In 2013, the value of NS-ON goods trade was $2.7 billion. Nova Scotia exported $1.1 billion worth of goods to Ontario and imported $1.6 billion worth of goods from Ontario.
Nova Scotia – Ontario: Exports
GOODS
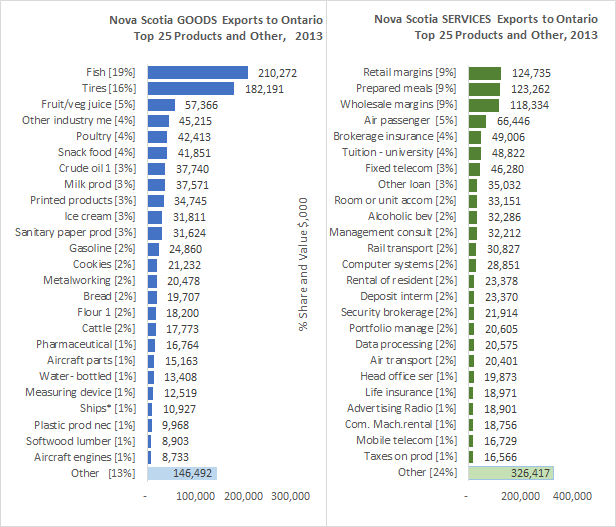
In Nova Scotia 2013, the top goods export to Ontario in 2013 was Fish, crustaceans, shellfish and other fishery products. Total value was $210.3 million and represent 19% of total goods exports. The number two goods commodity was Tires, valued at $182.2 million and representing 16% of total goods exports to Ontario.
The next four commodities, represent 17% of total goods exports are each valued in the $40,000 to $60,000 range, were 1) Fresh, frozen, canned fruit and vegetable juices, 2) Other industry specific machinery, 3) Fresh and frozen poultry, and 4) Snack food products.
The other 19 commodities in the top 25 in Nova Scotia export goods to Ontario represent another 35% of total goods exports, valued at $392.1 million.
The top 25 goods commodities total $971.4 million and represent 86.9% of Nova Scotia’s goods exports to Ontario.
SERVICES
Retail ($124.7 million) and Wholesale ($118.3 million) margins, along with Prepared Meals ($123.3 million), with almost equal shares, are the top three Nova Scotia's service exports to Ontario. They account for 27% of total services exports to Ontario.
The next four account for 16% of Nova Scotia's export services to Ontario: Air Passenger Transportation Services ($66.4 million); Brokerage and other insurance related services ($49 million); Tuition and similar fees for universities ($48.8 million); and Fixed telecommunication services (except internet access) ($46.3 million).
Together the top 7 account for 43% of service exports valued at $576.9 million.
Nova Scotia – Ontario Imports

GOODS
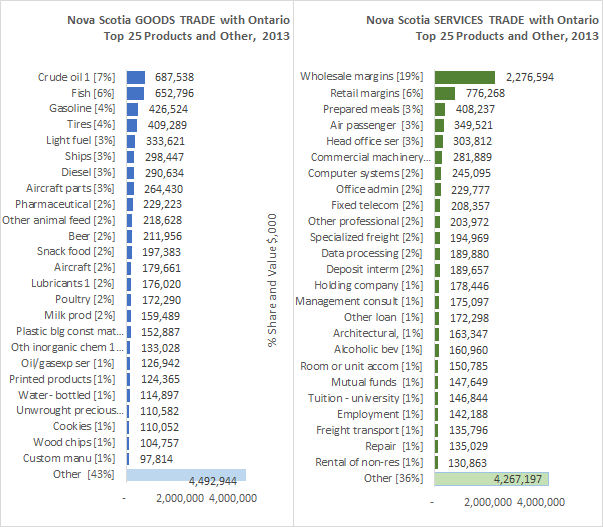
The top goods Nova Scotia import from Ontario in 2013 was Unwrought precious metals including alloys. Total value was $108.2 million and it represented 7% of total goods imports. (Note: This product attained its number one status due to the reorganization of product codes in the input-output tables. Until the 2014 data is published, it is uncertain if this occurrence is permanent or an anomaly.)
The number two goods commodity was Pharmaceutical and medicinal products, valued at $71.1 million and represent 5% of total goods imports from Ontario.
The next five commodities in order by value, represented 15% of total goods imported, were together valued at $233.1 million. They were 1) Gasoline, 2) Fruits and tree nuts, 3) Custom work manufacturing services (except printing, finishing textiles and metals), 4) Processed meat products and other miscellaneous meats and animal by-products, and 5) Printed products.
The other 18 commodities in the top 25 Nova Scotia import goods from Ontario represent another 35% of goods imports, valued at $544.8 million.
The top 25 goods commodities total $957.2 million and represent 61% of Nova Scotia's goods imports from Ontario.
SERVICES
Wholesale ($996.9 million) and Retail ($175.2 million) margins, are the top two products in Nova Scotia's service imports from Ontario. Together they are valued at $1.172 billion and account for 28% of total services imports from Ontario.
The next four account for 12% of Nova Scotia's import services from Ontario were together valued at $494.5 million: 1) Mutual funds (cost of service) and other similar services, 2) Holding company services and other financial investment and related activities, 3) Other professional, scientific and technical services, and 4) Deposit intermediation services indirectly measured (FISIM).
Together the top 6 account for 40% of service exports with a value of $1.67 billion.
The other 19 commodities in the top 25 Nova Scotia service import from Ontario represent another 32.1% of goods imports, and are valued at $1.335 billion.
The top 25 goods commodities total $3.0 billion and represent 72.2% of Nova Scotia's goods imports from Ontario.

Computed from Statistics Canada CANSIM table 381-0033
Input-Output Commodity Codes (IOCC)
<--- Return to Archive