The Economics and Statistics Division maintains archives of previous publications for accountability purposes, but makes no updates to keep these documents current with the latest data revisions from Statistics Canada. As a result, information in older documents may not be accurate. Please exercise caution when referring to older documents. For the latest information and historical data, please contact the individual listed to the right.
<--- Return to Archive
For additional information relating to this article, please contact:
March 20, 2017WHOLESALE TRADE, JANUARY 2017 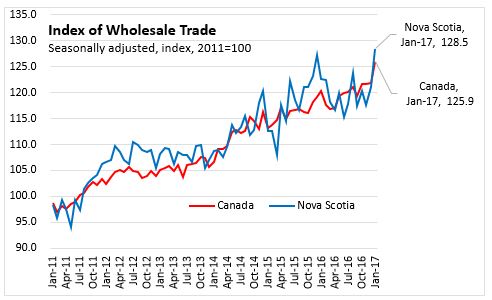
On a seasonally adjusted basis, wholesale sales rose 6.0 per cent to $838.2 million in Nova Scotia in January 2017. This was the second consecutively monthly gain and the largest dollar increase since June 2015. On a year-over-year basis wholesale sales were 4.8 per cent higher in Nova Scotia.
Canada's wholesale sales increased 3.3 per cent in January with the month being the largest percentage gain since November 2009. Sales were up in four of seven subsectors that account for 55 per cent of total sales with motor vehicle and parts subsector accounting for most of the gain. Compared to January 2016, wholesale trade in Canada was up 4.7 per cent.
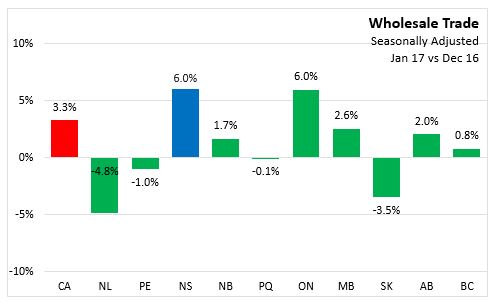
Nova Scotia ranked 1st, tied with Ontario, in terms of month-over-month percentage growth in wholesale trade. Six provinces had gains for the month while Newfoundland and Labrador, Prince Edward Island, Quebec, and Saskatchewan saw declines. On a year-over-year basis, Nova Scotia ranked 6th in percentage growth. Newfoundland and Labrador with 15.0 per cent growth since January 2016 ranked first, while only Prince Edward Island experienced a year-over-year decline.

By Sectors
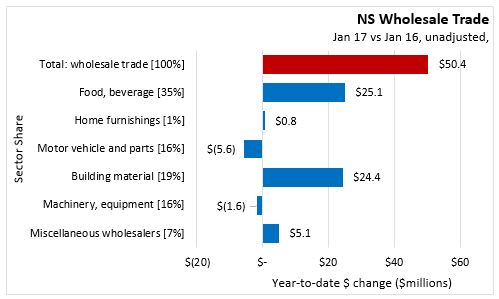
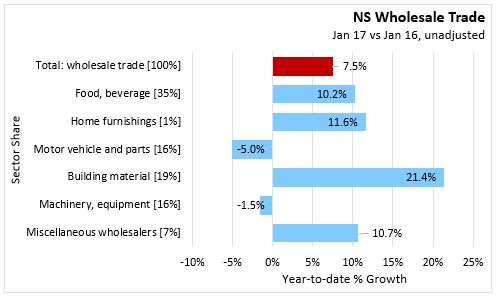
Before adjusting for seasonality, wholesale sales in Nova Scotia increased by $50.4 million or 7.5 per cent compared to January 2016. The dollar increase was largely accounted for by the two largest subsectors: food, beverage and tobacco wholesalers and building material and supplies wholesalers. Two subsectors had small declines compared to a year ago: motor vehicle and parts wholesalers and machinery, equipment and supplies merchant wholesalers.
Statistics Canada: CANSIM table 081-0011
<--- Return to Archive