The Economics and Statistics Division maintains archives of previous publications for accountability purposes, but makes no updates to keep these documents current with the latest data revisions from Statistics Canada. As a result, information in older documents may not be accurate. Please exercise caution when referring to older documents. For the latest information and historical data, please contact the individual listed to the right.
<--- Return to Archive
For additional information relating to this article, please contact:
February 15, 2017MANUFACTURING SHIPMENTS, DECEMBER and ANNUAL 2016
Nova Scotia
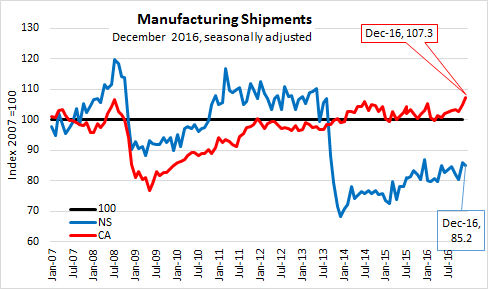
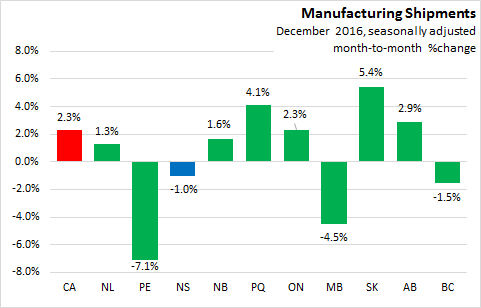
Nova Scotia’s manufacturing shipments (seasonally adjusted) decreased 1.0% in December to $692.9 million, and decreased 2.1% over December 2015.
Canada
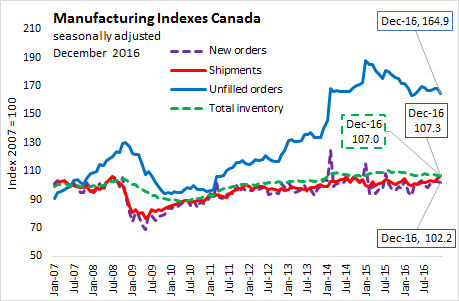
Canada manufacturing sales were up 2.3% to $53.5 billion in December, and up 4.1% above last year. Overall, sales were up in 8 of 21 industries as durable goods increased 2.4% and non-durable goods increased 2.1%.
Sales increased 7.4% in transportation equipment, and Petroleum and coal were up 11.6%. Sales decreased 5.0% in Computer and Electronic products
Inventory levels decreased 0.3% in December to $69.6 billion. Unfilled orders were down 1.9% to $87.7 billion.
Provinces
Manufacturing sales were up in six provinces in December and down in four provinces, including Nova Scotia.
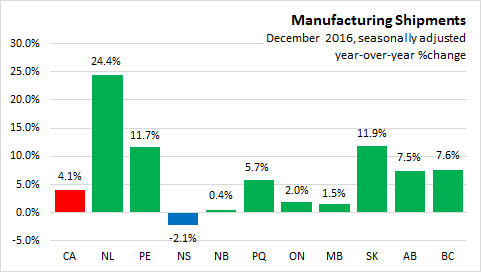
On a year-over-year basis (seasonally adjusted), manufacturing shipments are up 4.1% in Canada, with all provinces, except Nova Scotia, recording positive year-over-year growth. Newfoundland and Labrador led the way at 24.4%. Nova Scotia ranked 10th with a 2.1% decrease over December 2015.
ANNUAL
On a year-to-date basis, manufacturing shipments are positive in Canada, with gains in Prince Edward Island, Nova Scotia, Ontario, Manitoba, Saskatchewan and British Columbia.
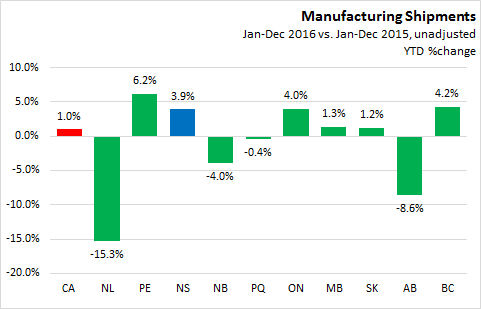
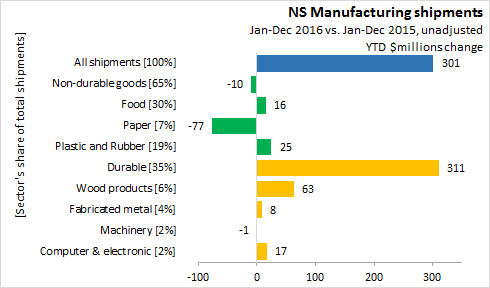
In Nova Scotia 2016, durables increased 12.5% or by $311 million over 2015. Non-duables declined 0.2%, or by $10 million. The $301 million difference provided a 3.9% annual increase in manufacturing shipments.
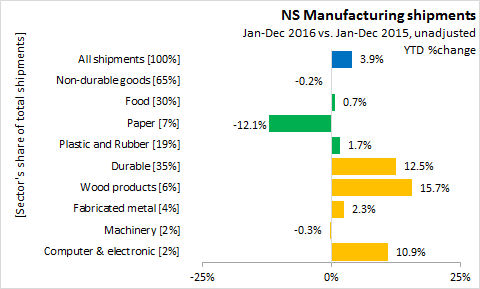
Year-to-date non-durable shipments (unadjusted) account for 65% of manufacturing shipments in 2016 and decreased 0.2% over the same period last year. Increases in food manufacturing (+0.7%) and plastic and rubber (+1.7%) were not sufficient to offset a decline in paper (-12.1%).
Year-to-date durable goods manufacturing has made up 35% of shipments in 2016, growing at 12.5%. Wood products, with a 6% share, are up 15.7% and Computer & Electronics with a 2% share are up 10.9%. Fabricated metal products, with a 4% share, are up 2.3%, and Machinery products, with a 2% share, are down 0.3%.
Statistics Canada Manufacturing Shipments December 2016 and
CANSIM 304-0015 and 304-0014
<--- Return to Archive