The Economics and Statistics Division maintains archives of previous publications for accountability purposes, but makes no updates to keep these documents current with the latest data revisions from Statistics Canada. As a result, information in older documents may not be accurate. Please exercise caution when referring to older documents. For the latest information and historical data, please contact the individual listed to the right.
<--- Return to Archive
For additional information relating to this article, please contact:
February 10, 2017LABOUR MARKET TRENDS - JANUARY 2017 LABOUR MARKET TRENDS - January 2017
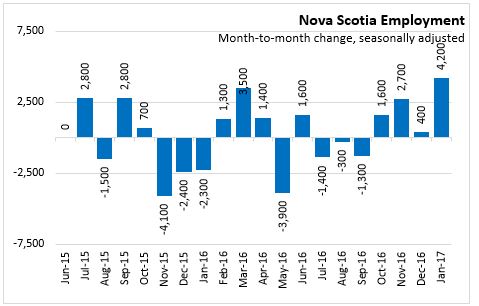
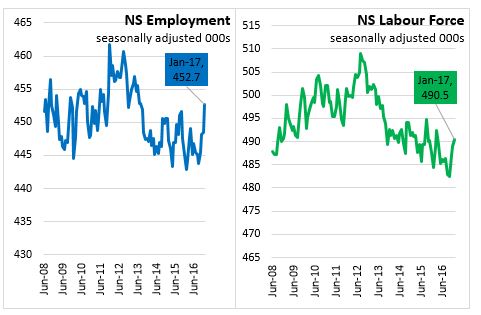
Nova Scotia's seasonally adjusted employment increased by 4,200 to 452,700 in January 2017. This is the fourth monthly increase in a row.
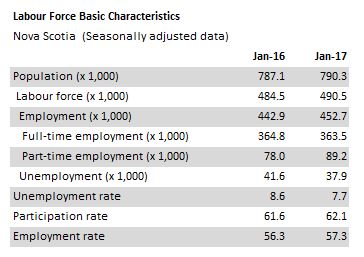
Compared to December, Nova Scotia’s labour force increased by 1,600 to 490,500 in January. With labour demand increasing at a faster pace than the labour force, the net result was a 0.6 percentage point fall in the seasonally adjusted unemployment rate to 7.7 per cent in January. With an increase in the labour supply outpacing growth in the working age population (+300) the participation rate climbed to 62.1 per cent for the month. With more jobs, January’s employment rate increased to 57.3 per cent.

In January, the overall increase in employment reflects gain of full-time employment (8,400) over riding the losses in part-time employment (-4,200). Shifts in the number of hours worked can result in swings between full-time and part-time jobs.
Compared with January 2016, the labour force has increased by 6,000 (1.2 per cent) while employment increased by 9,800 (2.2 per cent). Over this period, there was a shift from full time to part time employment. Full-time employment levels in January are down 1,300 from the same month last year, offset by an increase in part-time employment of 11,200. This can include switching the number of hours within the same position. Overall, with labour demand increasing at a faster pace than labour supply, the result was a 0.9 percentage point decrease in the seasonally adjusted unemployment rate from 8.6 per cent in January 2016 to 7.7 per cent in January 2016.
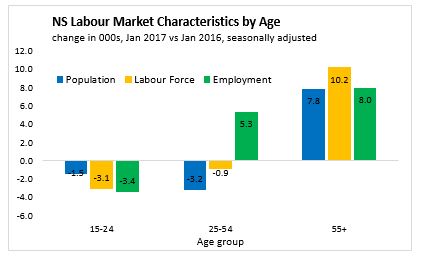
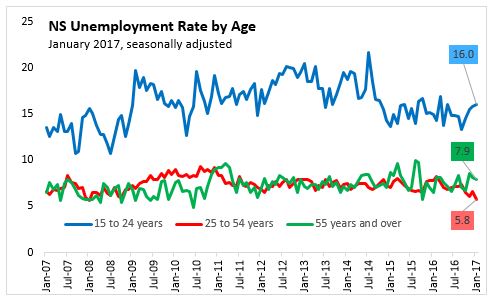
AGE COHORTS (January 2017 vs. January 2016)
The labour force survey population estimate of 15-24-year age group declined by 1,500 comparing January 2017 to January 2016. The age group saw a decline of 3,100 in the labour force and 3,400 in employment during this period as the number of unemployed increased. The unemployment rate increased 1.0 percentage points to 16.0 per cent for January 2017 over January 2016.
For Nova Scotians aged 25 to 54, the labour force declined 900 while employment increased 5,300 comparing the January 2017 to January 2016. With such a strong growth in labour demand overriding the fall in labour supply, the net result was a 2.0 percentage points drop in the unemployment to 5.8 per cent. The labour force participation rate climbed 0.5 percentage points to 86.5 per cent for this age group.
For those Nova Scotians aged 55 and over, the population, labour force and employment have all increased comparing January 2017 to January 2016. Employment increased by 8,000, slower than the rise in the labour force of 10,200, resulting in an increase in unemployment of 2,300 and an increase the unemployment rate of 1.4 percentage points to 7.9 per cent. Changes in this cohort are mostly attributable to those aged 55-64.
SECTORS (January 2017 vs. January 2016)
Comparing January 2017 to January 2016, employment in goods-producing sectors increased by 1,000 jobs. Employment gains in agriculture, forestry/fishing, utilities and construction more than offset a loss of 3,400 net jobs in the manufacturing sector.
There was a net gain of 8,800 jobs in service-producing sectors. Strong employment gains in wholesale/retail trade, health, professional services, public administration and other services were enough to override the job losses in financial services, educational, accommodation/food services and transportation and warehousing sector.
The increase in employment since January 2016 occurred with employees increasing by 6,200 and the self-employed increasing by 3,500. The gain in employees occurred with a gain of 6,600 jobs in the private sector and a decline of 400 in public sector employees.

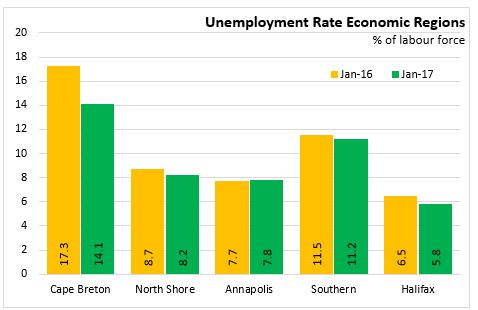
Regions (January 2017 vs. January 2016)
For January 2017 compared to January 2016, the Halifax, Cape Breton and North Shore regions reported employment growth that outpaced labour force growth, resulting in lower average unemployment rates. The South Shore economic regions unemployment rates fell as the labour force (labour supply) declined at a faster pace than labour demand (employment).
The Cape Breton region reported an increase in employment of 3,500 (8.0 per cent) for January 2017 over January 2016. The labour force climbed by 2,100 (4.0 per cent) for the same period. With labour demand increasing at a faster pace than labour supply, the result was a 3.2 percentage point decrease in the unemployment rate to 14.1 per cent.
For the North Shore region, employment increased 300 (0.4 per cent) for January 2017 over January 2016. Labour supply decreased by 100 (-0.1 per cent) for the same period. The increase in labour demand resulted in a 0.5 percentage point decline in the unemployment rate to 8.2 per cent.
The Annapolis region experienced a decline in employment of 900 (-1.7 per cent) followed by a fall in the labour force of 1,000 (-1.7 per cent) for January 2017 over January 2016. The net result was a increase of 0.1 percentage points in the average unemployment rate to 7.8 per cent.
The Southern region saw employment fall by 1,100 (-2.3 per cent) and the labour force had a decline of 1,500 (-2.8 per cent) for January 2017 over January 2016. The unemployment rate was down 0.3 percentage points to 11.2 per cent.
Comparing January 2017 compared to January 2016, Halifax (HRM) experienced an increase in employment of 2,500 (1.1 per cent) along with an increase of 1,100 (0.5 per cent) in the labour supply. With labour market demand increasing at a faster pace than labour supply, the net impact was 0.7 percentage point decrease in the unemployment rate to 5.8 per cent.
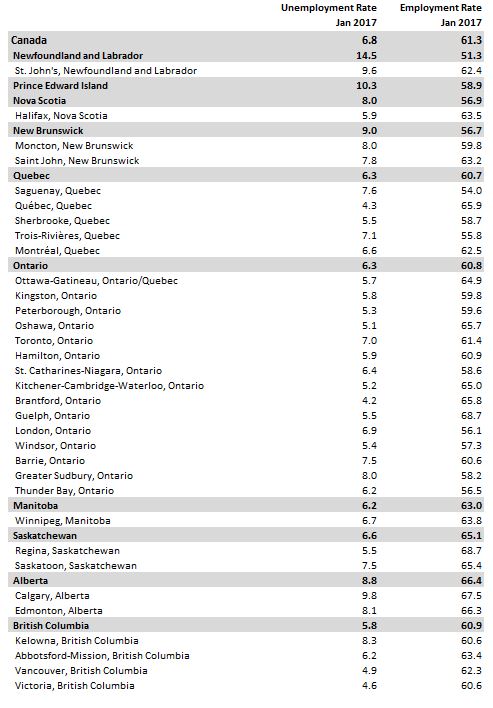
Provincial Comparisons
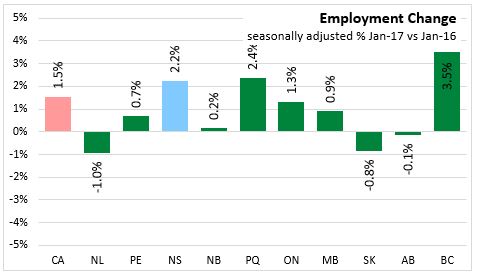
Employment increased 1.5 per cent in Canada comparing January 2017 with January 2016. Employment grew on a year over year basis in seven provinces with the largest gains in British Columbia (+3.5%), Quebec (+2.4%) and Nova Scotia (+2.2%). Three provinces had declines, Newfoundland and Labrador (-1.0%), Saskatchewan (-0.8%) and Alberta (-0.1%).
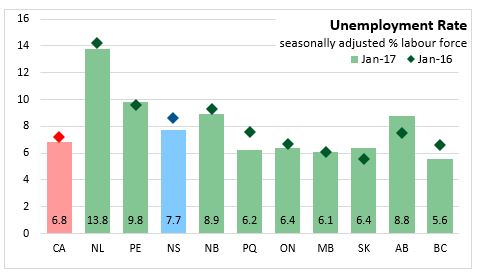
The Nova Scotia unemployment rate was 7.7 per cent in January 2017. In January of last year, the Nova Scotia unemployment rate was 8.6 per cent. Six provinces have lower unemployment rates compared to last year with Quebec (-1.4 percentage points) and British Columbia (-1.0 percentage points) having the steepest declines. The lowest unemployment rate among the provinces in January 2017 was in British Columbia at 5.6 per cent while the highest was in Newfoundland and Labrador at 13.8 per cent.
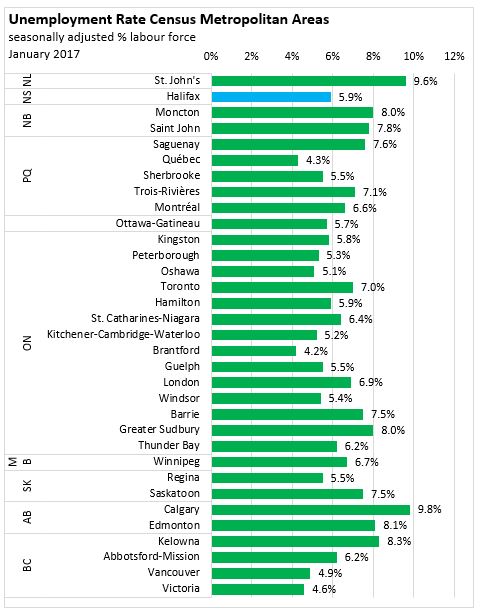
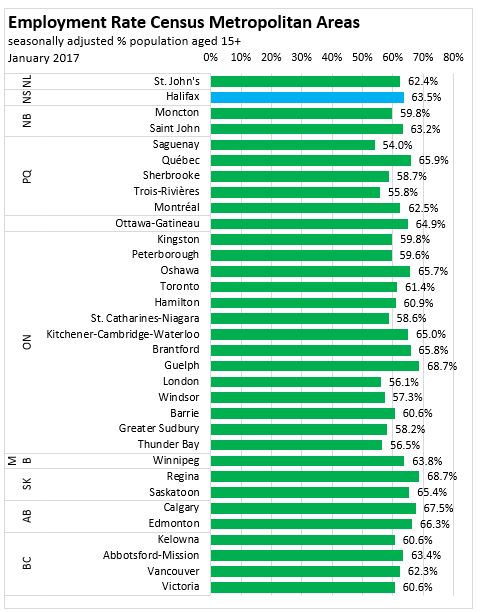
National Comparisons: Cities
The seasonally adjusted unemployment rate for the Halifax Census Metropolitan Area was 5.9 per cent. Brantford (4.2%) had the lowest unemployment rate for a CMA this month.
The seasonally adjusted employment rate for the Halifax Census Metropolitan Area was unchanged from last month at 63.5 per cent in January 2017.
The three month average employment ending in December for the Halifax CMA increased 0.1 per cent compared to the three month period ending in December. The largest gain among CMAs was in Brantford, Ontario were employment rose 1.8 per cent.
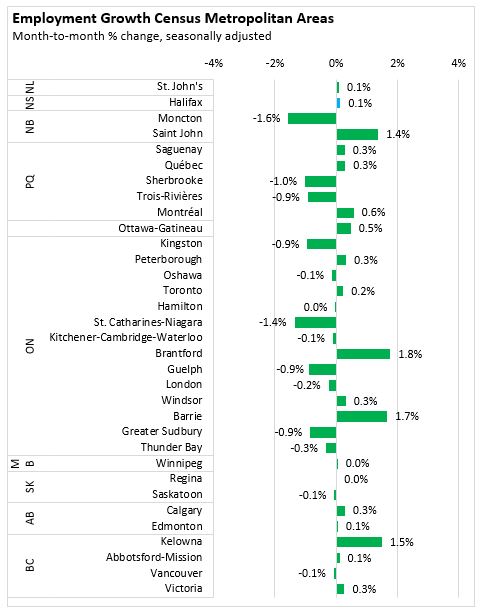
Note: Seasonally adjusted, 3 month average.
<--- Return to Archive