The Economics and Statistics Division maintains archives of previous publications for accountability purposes, but makes no updates to keep these documents current with the latest data revisions from Statistics Canada. As a result, information in older documents may not be accurate. Please exercise caution when referring to older documents. For the latest information and historical data, please contact the individual listed to the right.
<--- Return to Archive
For additional information relating to this article, please contact:
February 06, 2017STUDY: IMMIGRATION AND DIVERSITY: POPULATION PROJECTIONS FOR CANADA AND ITS REGIONS, 2011 TO 2036 Statistics Canada released a study (January 25th, 2017) analyzing the demographic make up of seven different population projection scenarios for Canada, the provinces, and CMAs from 2011 to 2036. In general, the results show a significant increase in diversity expected across the country, as measured by the proportion of the population who are immigrants, who are visible minorities, who have a a mother tongue that is neither English nor French, and who are affiliated with non-Christian religions or no religion. The results are generally consistent across the country.
Note that while the study analyzed seven scenarios, the results summarized below refer to either the reference case, or the spread between the minimum and maximum for each indicator.
Immigration Status
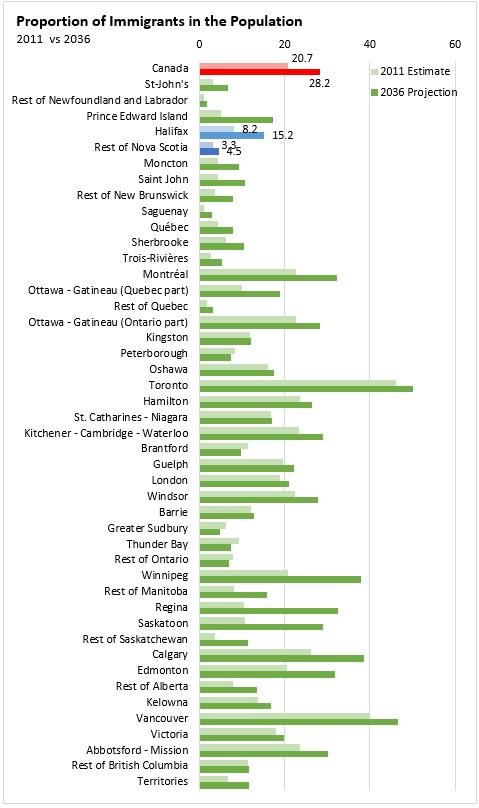
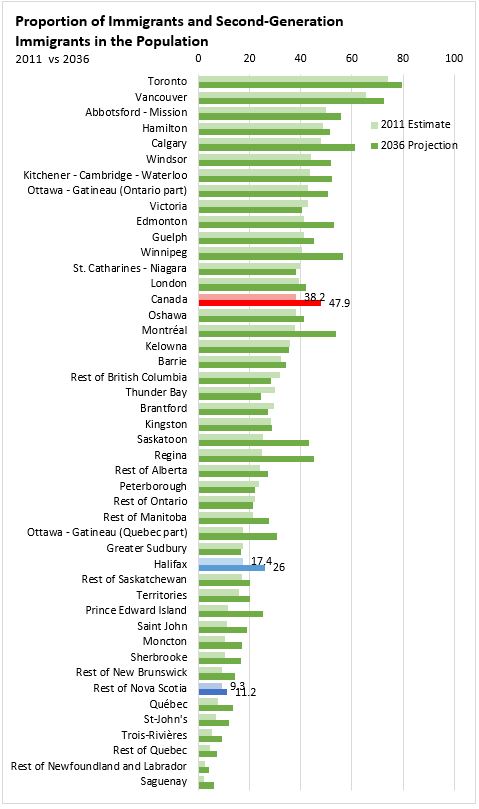
The study found that by 2036, immigrants would account for between 24.5 and 30.0 per cent of the Canadian population, up from 20.7 per cent in 2011. This would be the highest proportion since 1871. The proportion of second-generation immigrants (Canadian-born individuals with at least one immigrant parent) would be nearly 20 per cent, up from 17.5 per cent in 2011. Together, first and second-generation immigrants would represent between 44.2 and 49.7 per cent of the Canadian population in 2036, up from 38.2 per cent in 2011.
In 2036, the vast majority of immigrants will continue to live in urban areas, with between 91.7 and 93.4 per cent living in a CMA. A third or more of all immigrants will live in Toronto, while 60 per cent or more will live in Toronto, Montreal, and Vancouver.
In 2011, immigrants accounted for 5.3 per cent of the Nova Scotian population. That proportion is expected to rise to between 7.7 and 10.7 per cent in 2036. This is due to both an increase in immigrants nationally and an increase in Nova Scotia's share of national immigrants. Halifax is expected to accounted for an increasing share of the province's immigrants, from 64.9 per cent in 2011 to between 74.7 and 76.3 per cent in 2036. The main birthplaces of immigrants in Nova Scotia in 2036 would be Northern Europe, and West and Central Asia and the Middle East.
Visible Minority Status
In 2036, between 34.7 and 39.9 per cent of the Canadian working age population could belong to a visible minority group, up from 19.6 per cent in 2011. Growth in this indicator is wide spread across every region. In Halifax, the proportion is expected to more than double from 9.0 per cent in 2011 to 20.9 per cent in the reference case for 2036. In the rest of Nova Scotia, the proportion is also expected to double, from 2.3 per cent to 5.2 per cent.

Religion
The major shift expected in the population's religion is a significant rise in the proportion of people who report having no religion, from 24.0 per cent in 2011 to between 28.2 and 34.6 per cent in 2036. Catholicism would remain the largest religion in the country, with between 29.2 and 32.8 per cent of the population, though that would be down from 38.8 per cent in 2011. The proportion of the population with non-Christian religions could increase from 9 per cent to between 13 and 16 per cent, with the largest growth among Muslims, Hindu, and Sikhs.
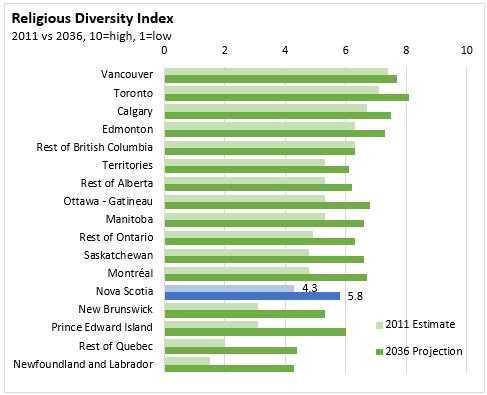
The chart below shows the calculated "Religious Diversity Index" for the provinces and largest cities. The Index ranges from zero to ten, where zero would represent a region where everyone had the same religion and ten would represent a region where every religous category considered had an equal proportion of the population. Nova Scotia is projected to increase from a score of 4.3 to 5.8, indicating an increase in religious diversity but still remaining less diverse than all other provinces except for New Brunswick, Newfoundland and Labrador, and Quebec outside of Montreal.
Language
In Canada, the population whose mother tongue is neither English nor French would account for between 26.1 and 30.6 per cent of the total in 2036, up from 20.0 per cent in 2011. Of those, close to 40 per cent would have adopted English or French as the language spoken most often at home.
Source: Statistics Canada, Demosim team: Immigration and Diversity: Population Projections for Canada and its Regions, 2011 to 2036
<--- Return to Archive