The Economics and Statistics Division maintains archives of previous publications for accountability purposes, but makes no updates to keep these documents current with the latest data revisions from Statistics Canada. As a result, information in older documents may not be accurate. Please exercise caution when referring to older documents. For the latest information and historical data, please contact the individual listed to the right.
<--- Return to Archive
For additional information relating to this article, please contact:
January 27, 2017GROSS DOMESTIC PRODUCT BY CENSUS METROPOLITIAN AREA, 2009 TO 2013 Today, Statistics Canada released data on the gross domestic product estimates for the 33 census metropolitan areas (CMAs) and 10 non-CMA. The estimates are for 2009 and 2013 with annual data releases to continue with a three and half year lag to the reference year. The estimates are not adjusted for price (current dollars) and are measured at basic prices.
In 2013, Canada's GDP was $1.77 trillion with the 33 CMAs production totaling $1.27 trillion. The share of GDP in current dollars coming from the CMAs declined from 72.8 per cent in 2009 to 71.4 per cent in 2013 as increased mining and oil and gas extraction in non-CMA areas lifted their share. CMAs account for more than half of production for all sectors except two: mining, oil and gas extraction and agriculture, forestry, fishing and hunting.
From 2009 to 2013, the share of GDP coming from Edmonton and Calgary increased while the share fell for Toronto, Montreal and Ottawa-Gatineau. The six CMAs of Edmonton, Calgary, Toronto, Montreal, Vancouver and Ottawa-Gatineau account for more than half of Canada's GDP. For the period 2009 and 2013, the share of GDP from Halifax declined from 1.2 per cent to 1.1 per cent.

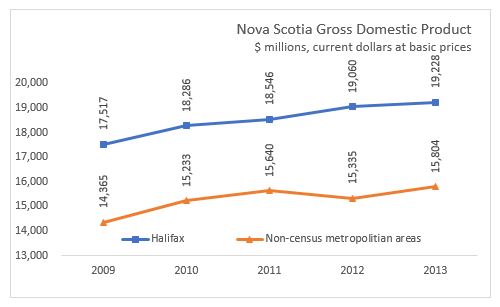
Nova Scotia's GDP in 2009 was $31.9 billion with Halifax accounting for 54.9 per cent with a GDP of $17.5 billion. Outside of Halifax GDP was $14.4 billion in 2009 with a 45.1 per cent share. In 2013, the share between Halifax and non-CMA areas was the same as 2009 with both areas growing at a similar average rate of 2.4 per cent per year over the 2009 to 2013 period. In 2013, Halifax GDP was $19.2 billion and non-CMA Nova Scotia was $15.8 billion.

Winnipeg is the most dominant CMA in a province with its GDP accounting for 63 per cent of Manitoba's GDP. Vancouver, Toronto, Montreal and Halifax also accounted for at least 50 per cent of their respective provinces GDP in 2013. In Newfoundland and Labrador, Prince Edward Island, New Brunswick, and Saskatchewan more than 50 per cent of GDP is from outside any CMA.

CMAs had a GDP per capita of $51,746 per person while non-CMAs GDP per capita was $47,807 per person in 2013. GDP per capita was largest in non-CMA Alberta at $97,757 per person and smallest in Oshawa at $28,784 per person. Among the CMAs, Edmonton overtook Calgary to have the highest GDP per capita at $76,355 per person. Alberta, Saskatchewan and Newfoundland and Labrador had GDP per capita higher in the non-CMA region than in all their provincial CMAs. For Nova Scotia, Halifax GDP per capita was $46,898 per person and non-CMA, Nova Scotia GDP per capita was $29,621 per person in 2013.

Statistics Canada: Gross domestic product at basic prices, by census metropolitan area, 2009 to 2013
<--- Return to Archive